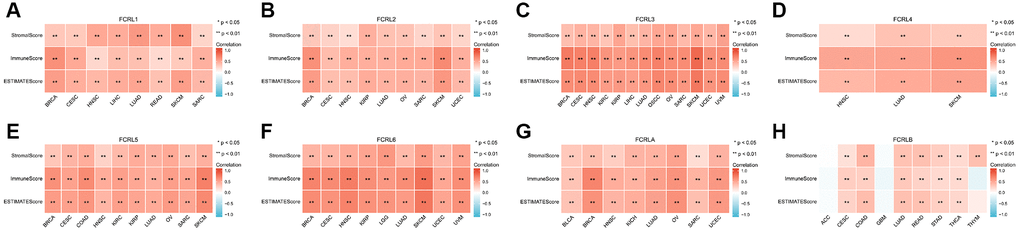
Figure 10.Correlation between FCRL family gene expression and tumor purity in cancers impacting OS. Correlations between (A) FCRL1, (B) FCRL2, (C) FCRL3, (D) FCRL4, (E) FCRL5, (F) FCRL6, (G) FCRLA, (H) FCRLB expression and Stromalscore, Immune score, and ESTIMATE score. ∗p < 0.05, ∗∗p < 0.01.