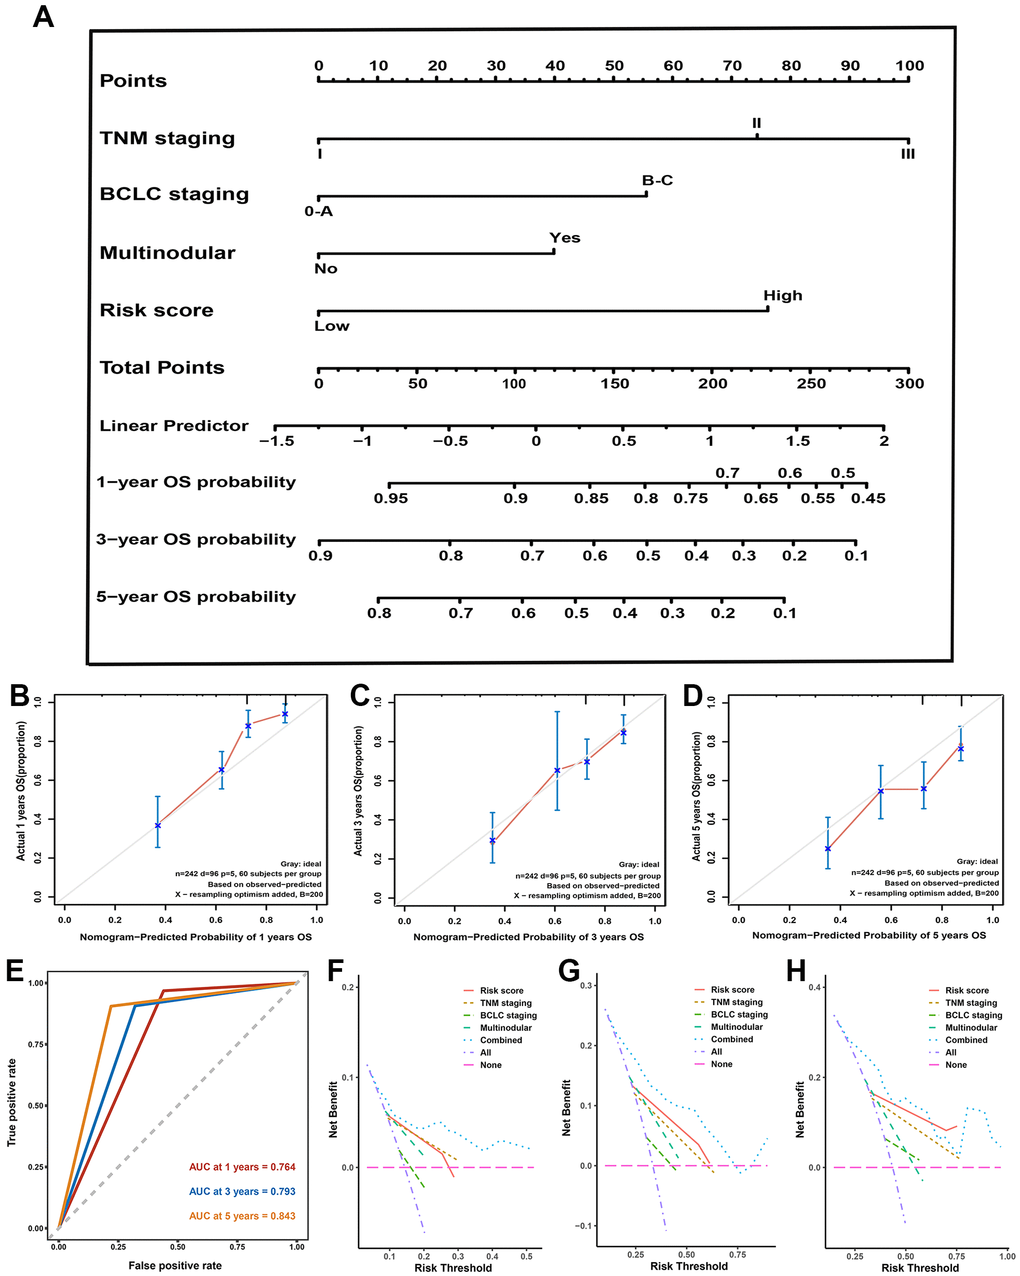
Figure 5.Nomogram, calibration plot, decision curve analysis in training set. (A) Predictive nomogram for prediction of 1-, 3-, and 5-year overall survival rates. (B–D) The calibration curve to detect the predictive performance of nomogram in 1- (B), 3- (B), and 5-year (C) overall survival rates. (E) The time-dependent Receiver operating characteristic curve for 1-, 3-, and 5-year to validate the predictive performance of nomogram. (F–H) The decision curve analysis exhibited the highest net benefit of the nomogram for 1- (F), 3- (G), and 5-year (H) overall survival rates.