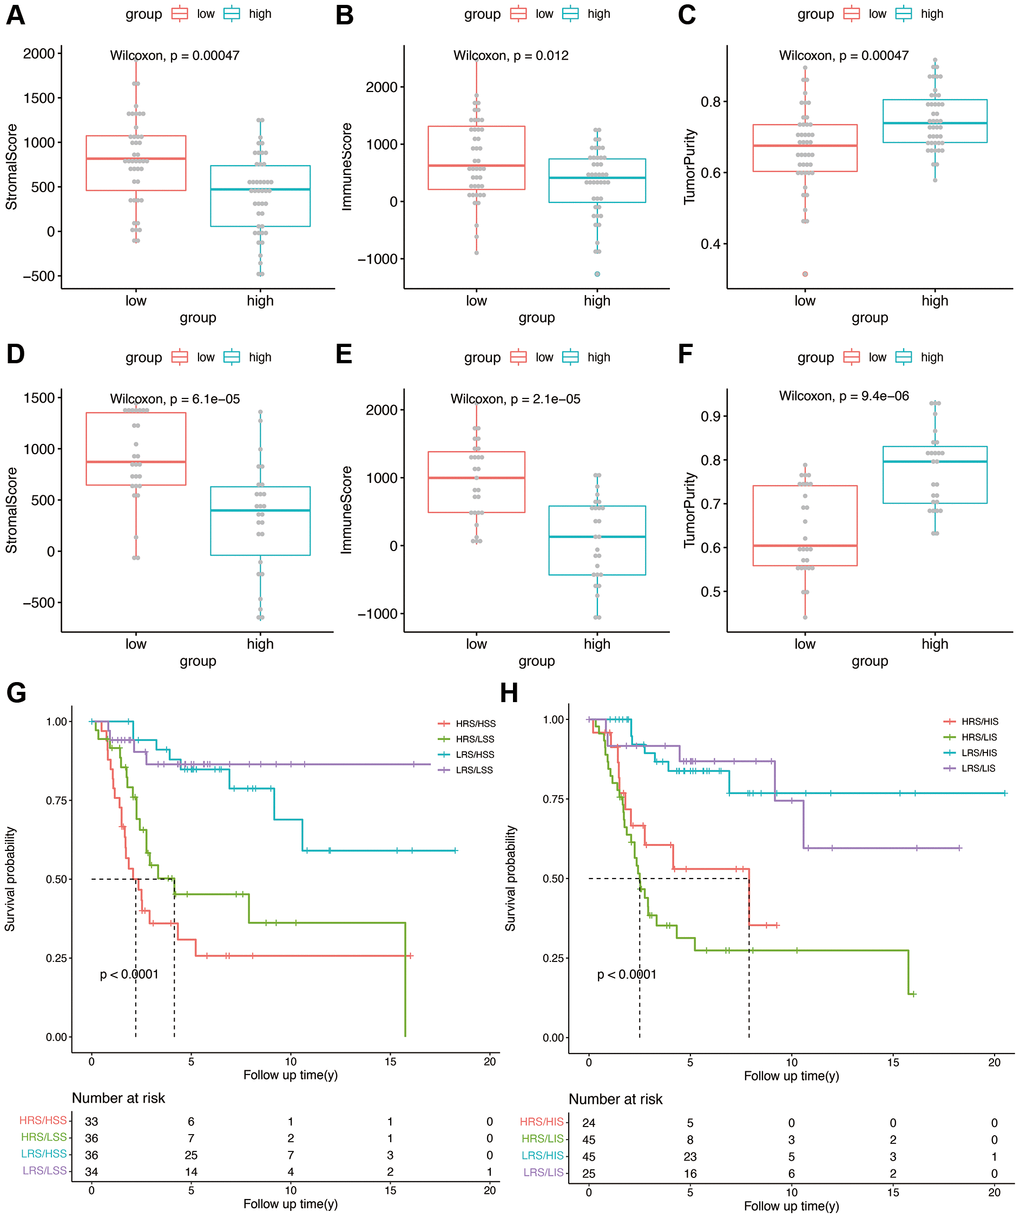
Figure 6.(A–C) Stromal score, immune score, and tumor purity in the high- and low-risk groups in the TARGET cohort. (D–F) Stromal score, immune score, and tumor purity in the high- and low-risk groups in the validation cohort. (G) Kaplan-Meier analysis combining risk score and stromal score. (H) Kaplan-Meier analysis combining risk score and immune score.