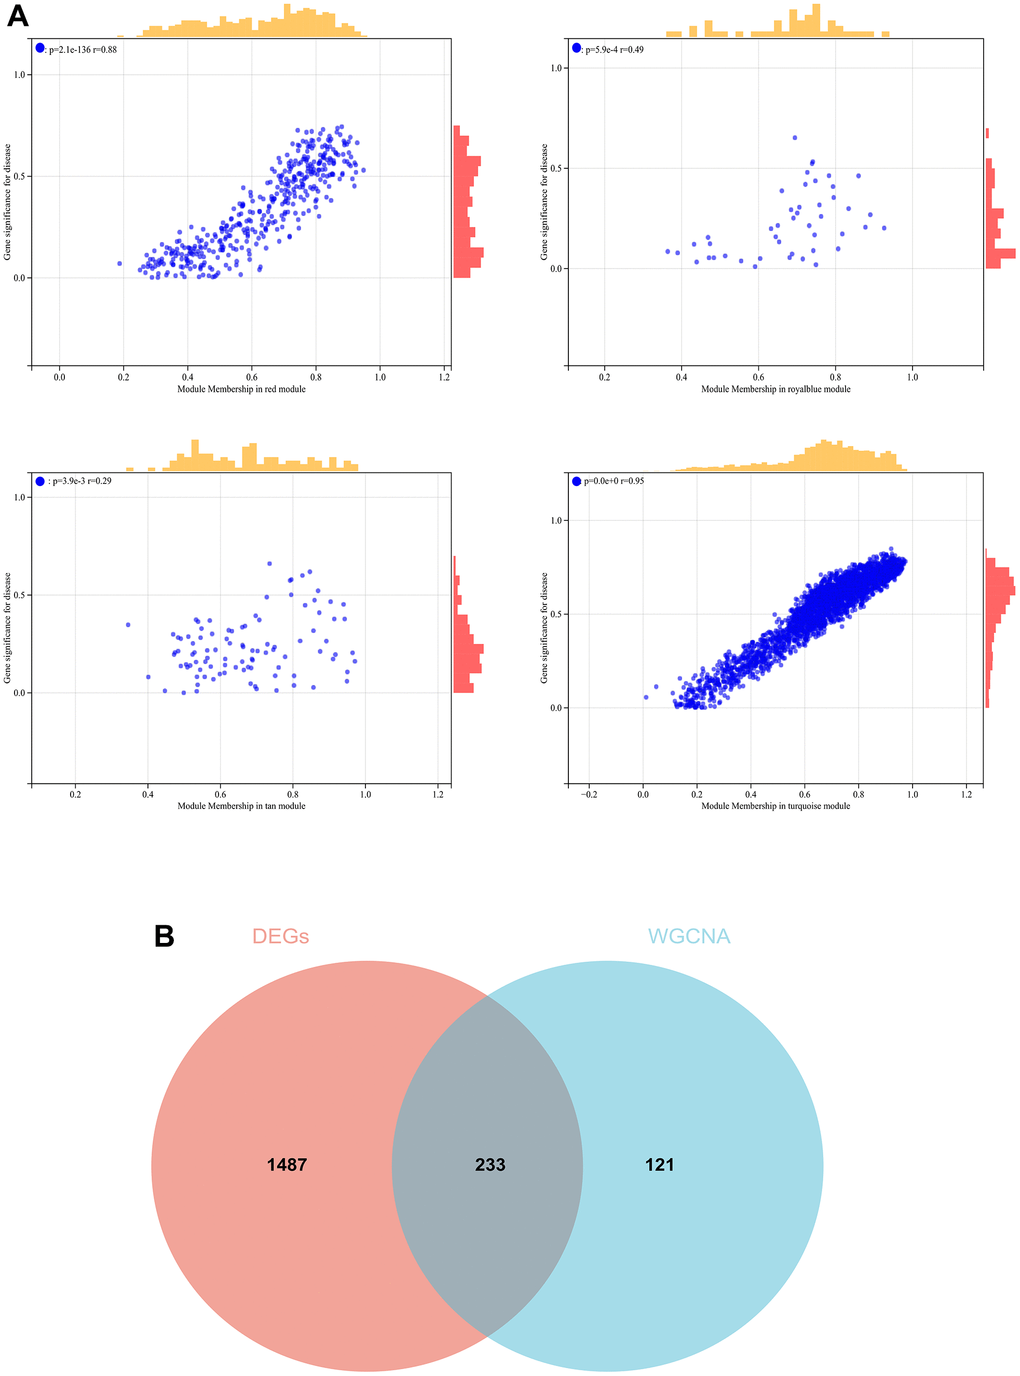
Figure 8.The conjoint analysis for the WGCNA and the DEGs. (A) Correlation analysis by WGCNA. (B) A Venn diagram was generated by intersecting the differentially expressed genes (DEGs) selected by WGCNA and DEGs and was then used to create and analyze a protein-protein interaction network.