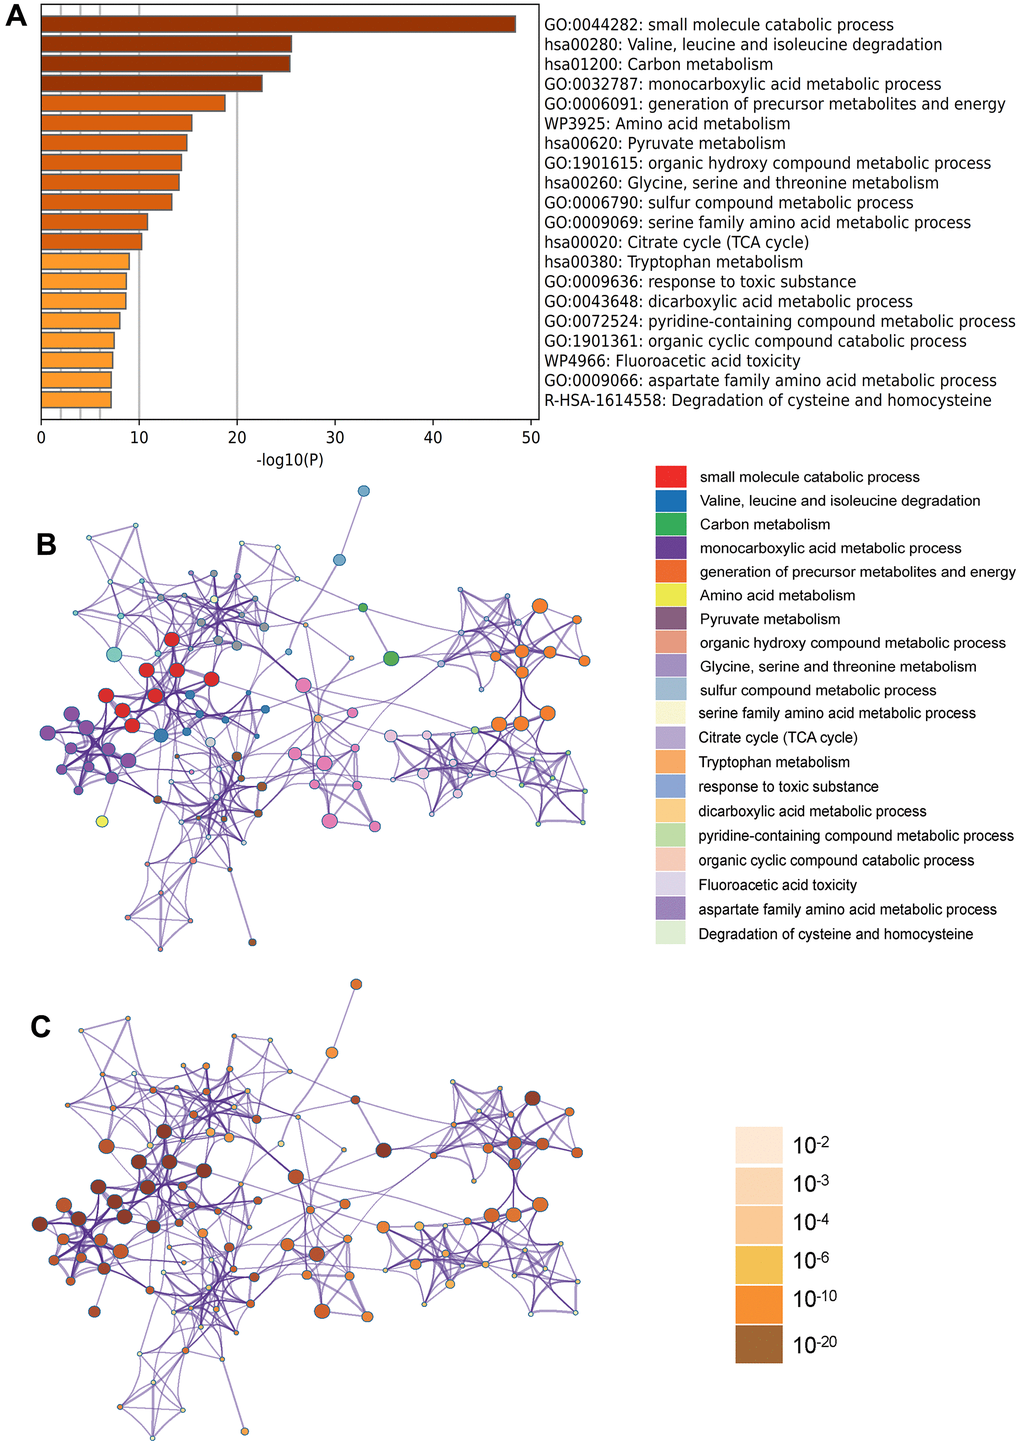
Figure 3.Metascape enrichment analysis. (A) Heatmap of enriched terms across input differently expressed gene lists, colored by p values, via Metascape; (B) Network of enriched terms colored by cluster identity, where nodes that share the same cluster identity are typically close to each other; (C) Network of enriched terms colored by p value, where terms containing more genes tend to have a more significant p value.