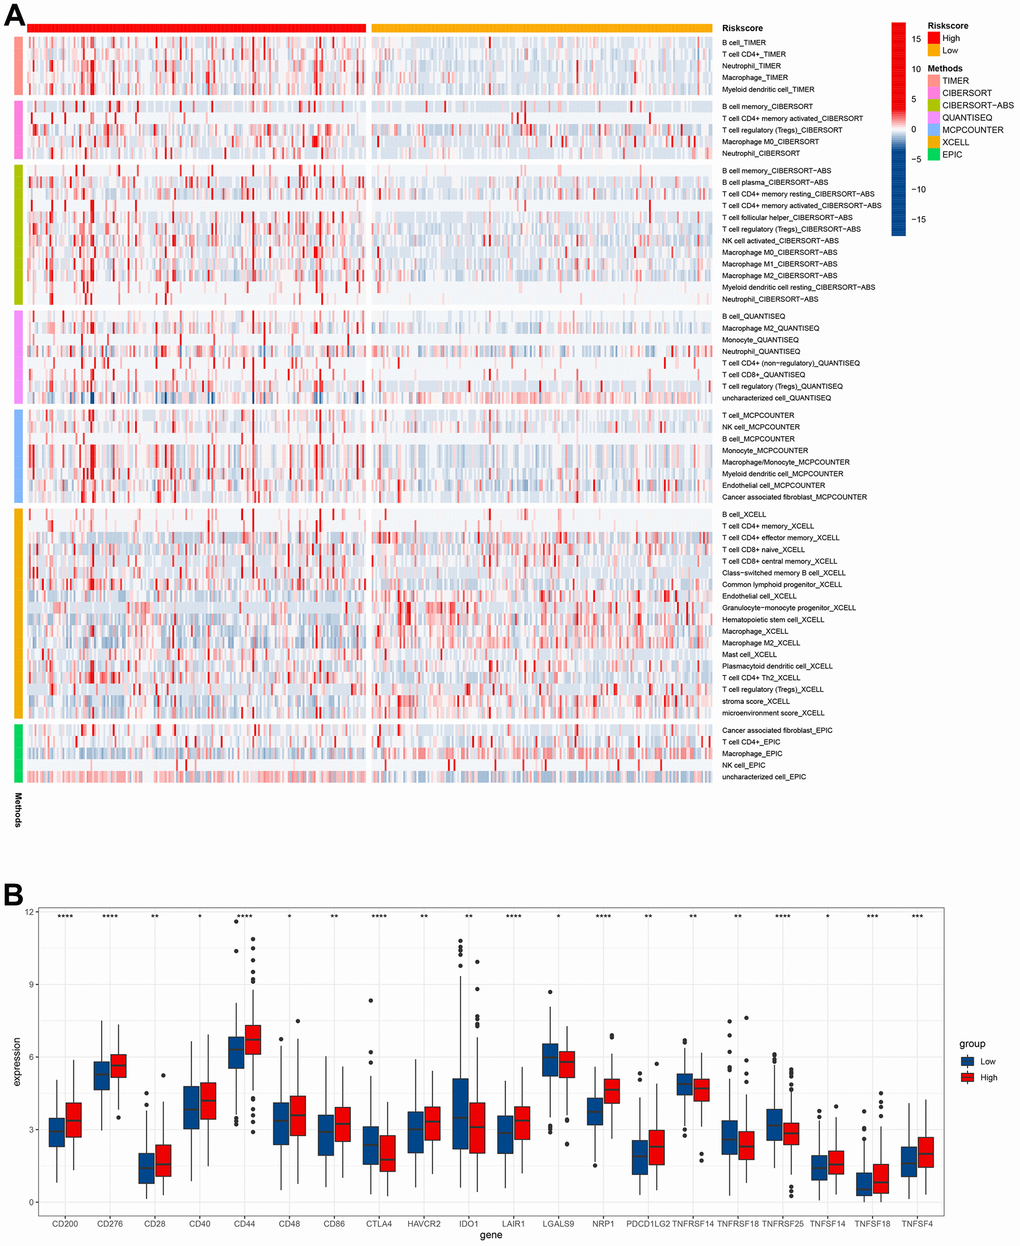
Figure 9.Immune infiltration level analysis based on the risk model. (A) Immune cells infiltration between high-risk groups and low-risk groups. (B) The expression of immune checkpoints between high-risk groups and low-risk groups.
Figure 9 — Comprehensive analysis of cuproptosis-related immune biomarker signature to enhance prognostic accuracy in gastric cancer | Aging