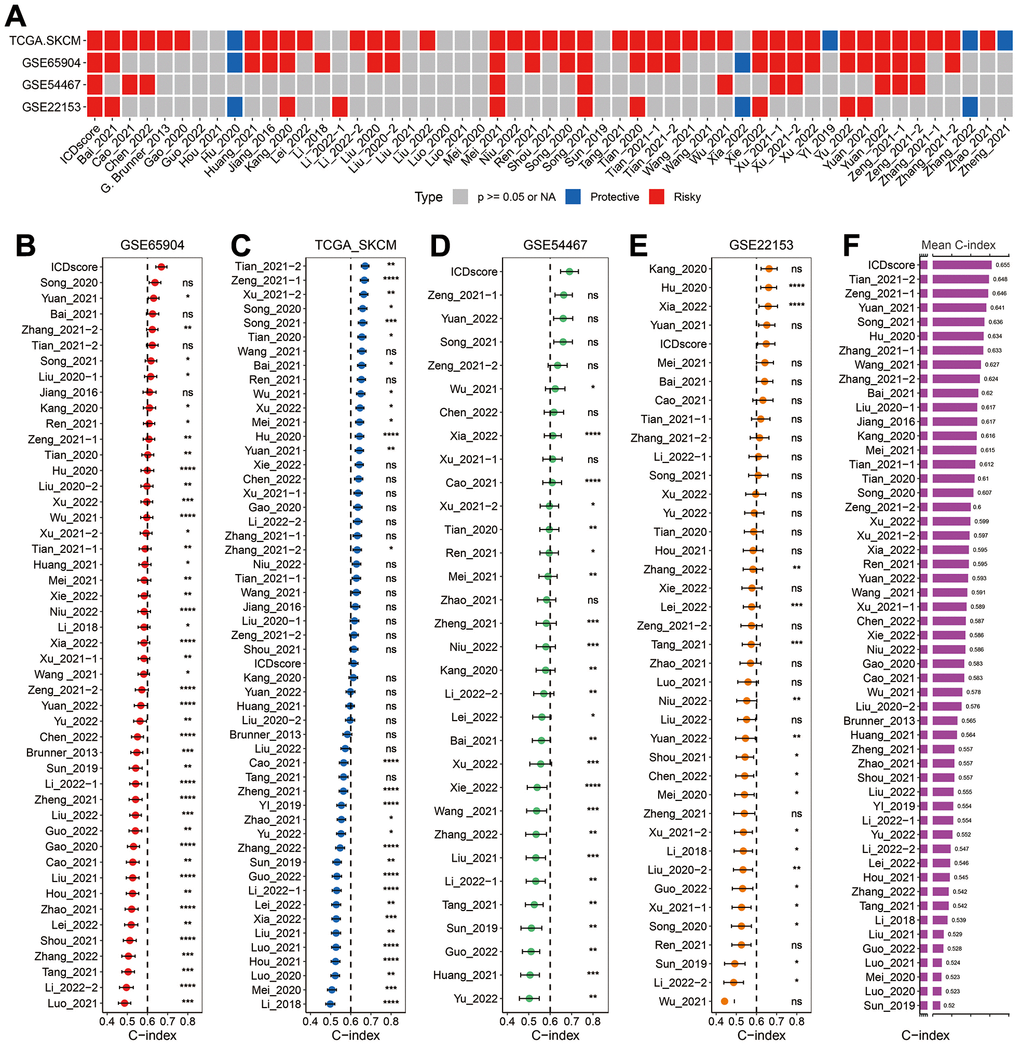
Figure 8.Comparison between ICDscore and other published signatures. (A) Univariate Cox regression analysis of ICDscore and 52 published signatures in GSE65904, TCGA-SKCM, GSE54467, and GSE22153 datasets. (B–E) C-index analyses of ICDscore and 52 published signatures in GSE65904 (B), TCGA-SKCM (C), GSE54467 (D), and GSE22153 (E) datasets. Statistic tests: two-sided z-score test. Data are presented as mean ± 95% confidence interval [CI]. (F) The average C-index of ICDscore and 52 published signatures across all the 4 datasets. Ns, not significant; *p < 0.05; **, p < 0.01; ***, p < 0.001; ****, p < 0.0001.