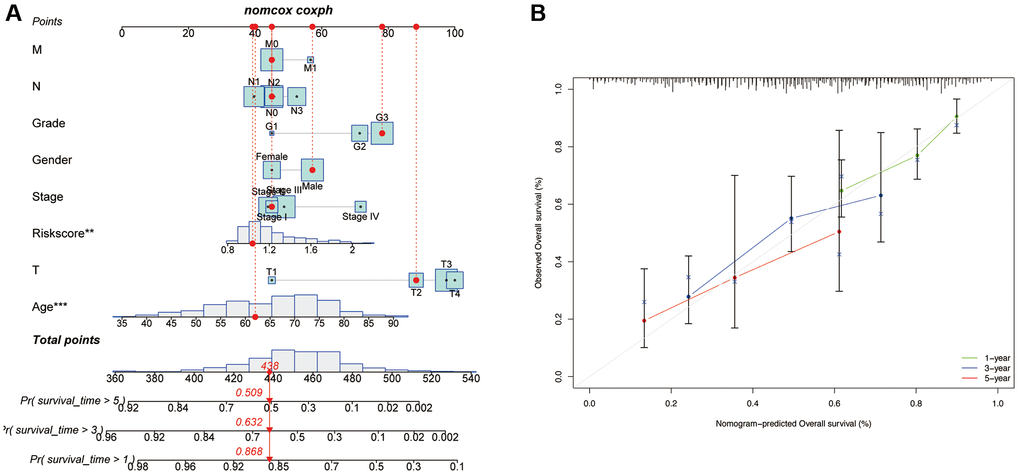
Figure 8.Development of a nomogram based on risk scores and clinical characteristics. (A) Nomograms to predict the overall survival of GC patients at 1-, 3-, and 5-year using data from TCGA. The red dashed line represented a sample of GC patient’s death probability by year 1, 3, and 5. (B) Calibration plot of the nomogram.