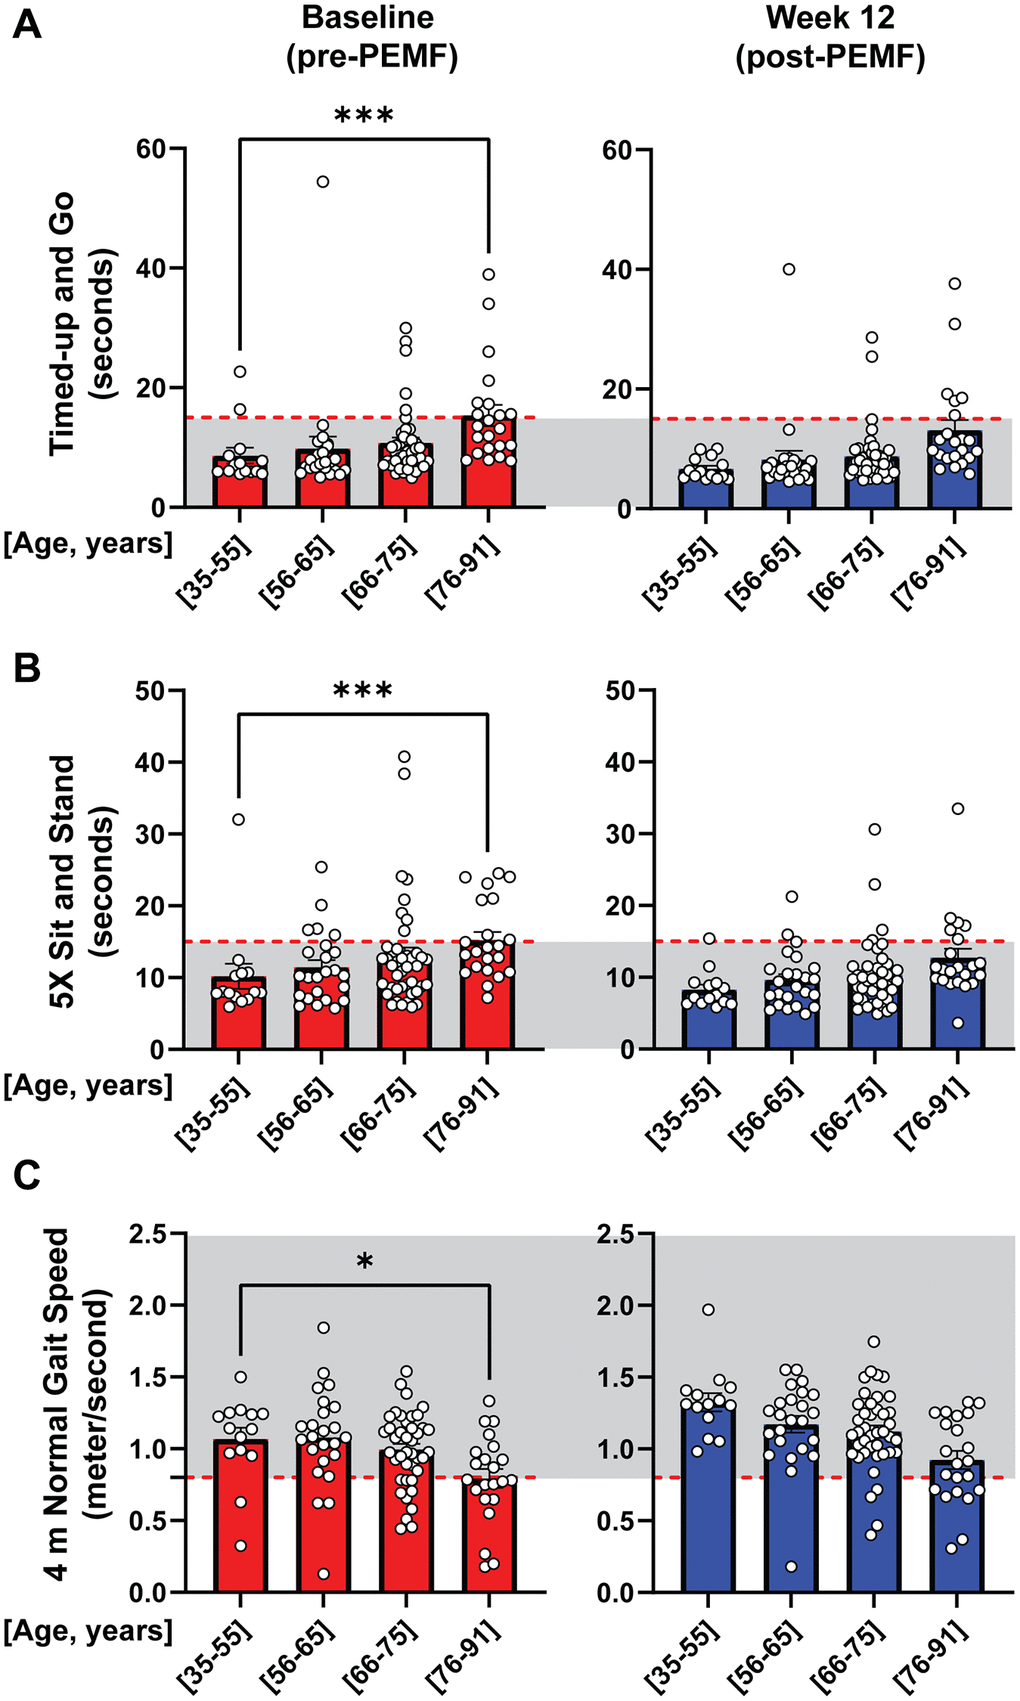
Figure 2.Age-stratified changes in mobility function, pre- and post-PEMF therapy. Bar charts depicting age-stratified performance at baseline (pre-PEMF; red bars) and following 12 weeks of PEMF therapy (blue bars) in the TUG (A), 5xSTS (B), and 4mNGS (C) mobility tests. The gray shaded areas represent cutoffs of ≤14 seconds, ≤15 seconds and ≥0.8 m/s indicative of safety from physical failing reported for the TUG [29], 5xSTS [30], and 4mNGS [31], respectively. The number of subjects per age bracket are as follow: (35–55) = 14, (56–65) = 24, (66–75) = 41, and (76–91) = 22. Statistical analysis was carried out using One-Way ANOVA and Kruskal-Wallis multiple comparisons test, with *p < 0.05, **p < 0.01 and ***p < 0.001.