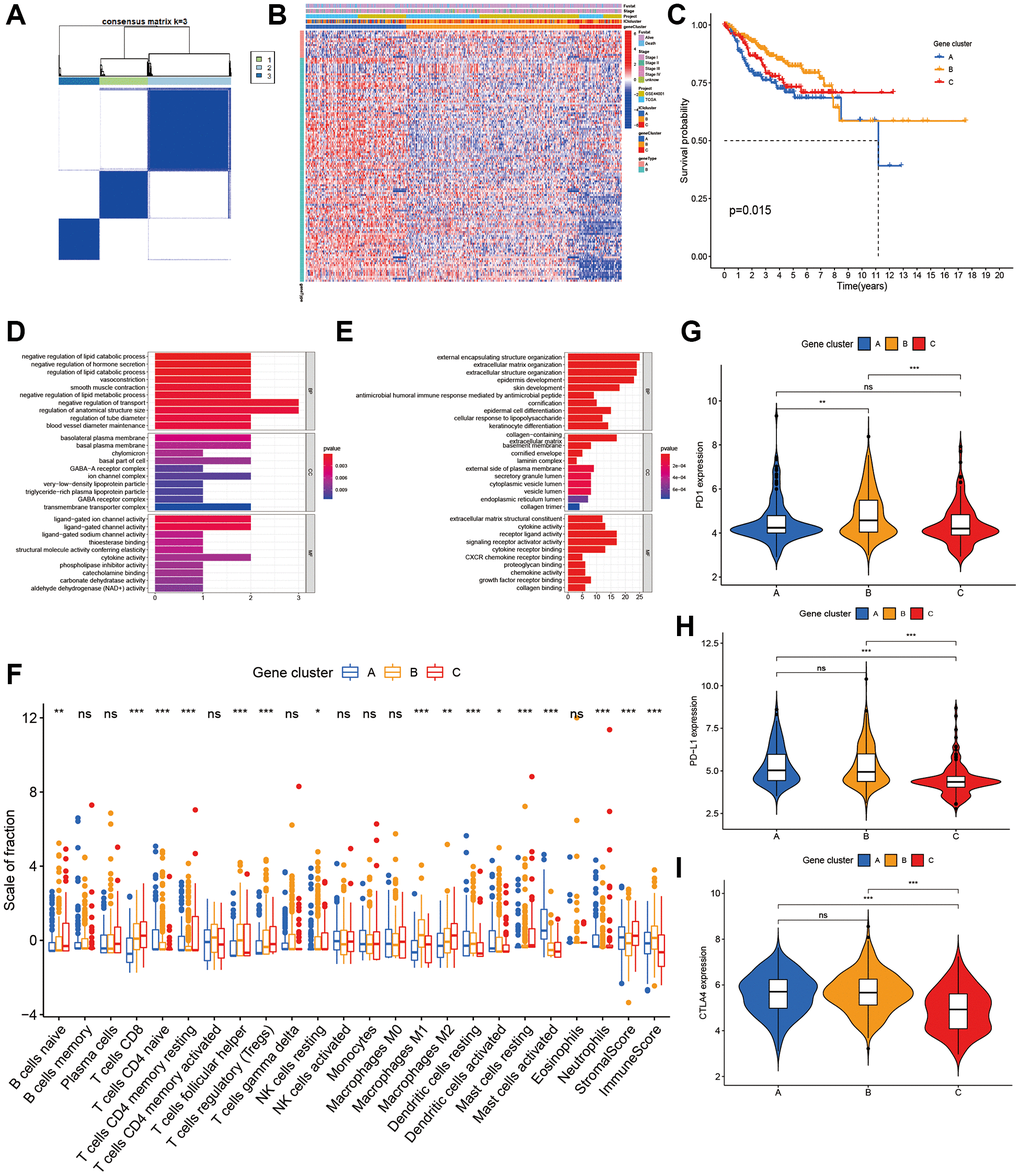
Figure 2.Characterization of ICI Gene clusters. (A) Cluster results of DEGs. (B) Heat map of DEGs characteristics. (C) Kaplan-Meier curves of CC patients with DEGs classes. (D, E) GO analyses of ICI signature genes A (D) and B (E). (F) The immune cell component in three gene clusters. (G–I) The difference in PD1 (G), PD-L1 (H) and CLTA4 (I) expression among three ICI gene clusters.