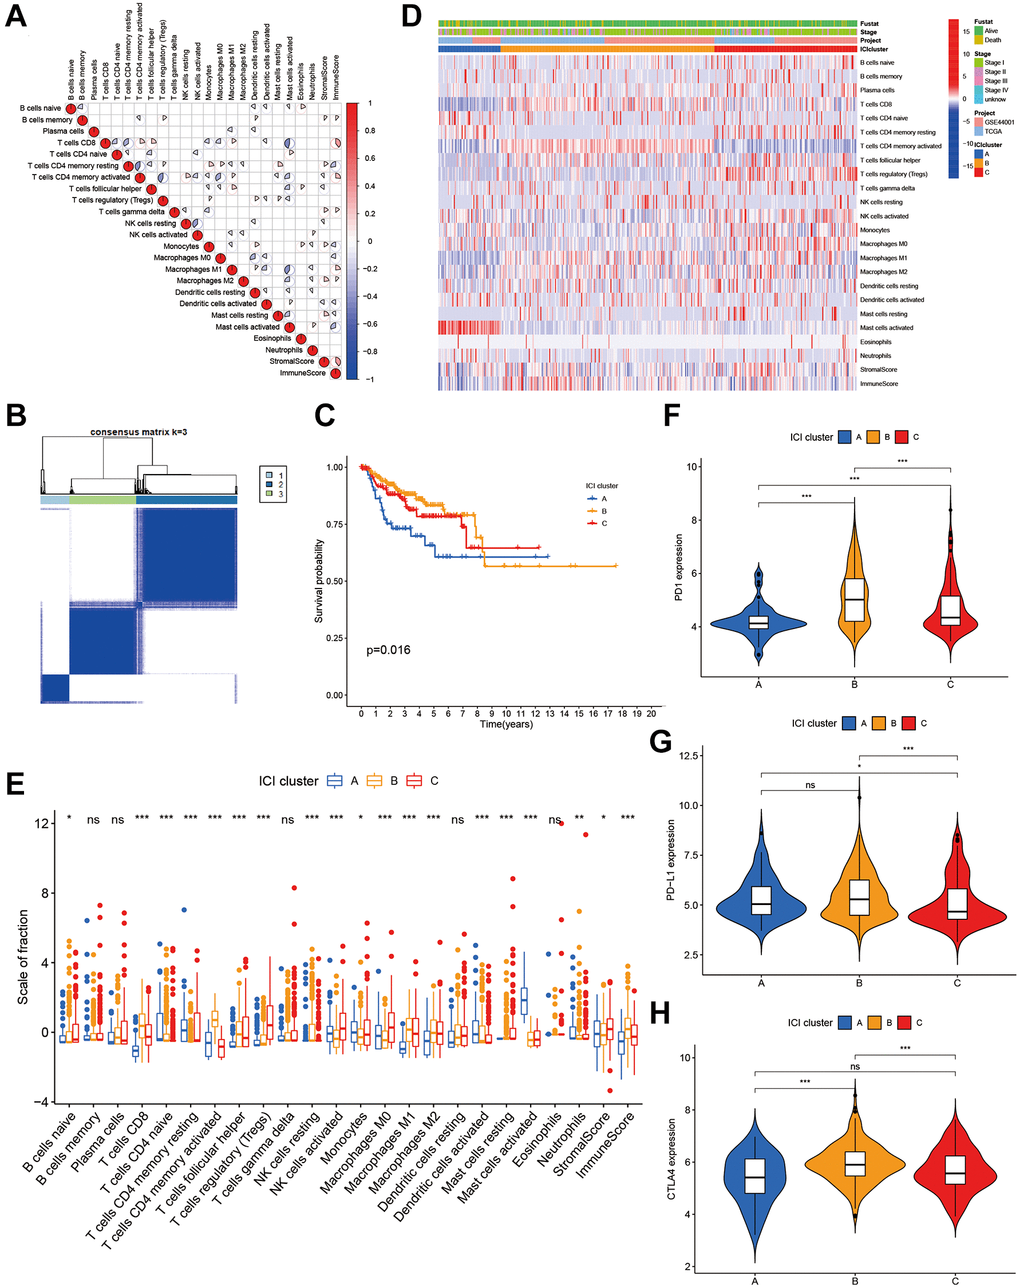
Figure 1.The landscape of immune cells in the TME of CC. (A) Correlation coefficient heatmap of the infiltrating immune cell types. (B) Unsupervised clustering of immune cells. (C) Kaplan-Meier curves of immune cell clusters. (D) Immune cell infiltration heat map. (E) The composition of immune cells in three ICI clusters. (F–H) The difference in PD1 (F), PD-L1 (G) and CLTA4 (H) expression among three ICI clusters.