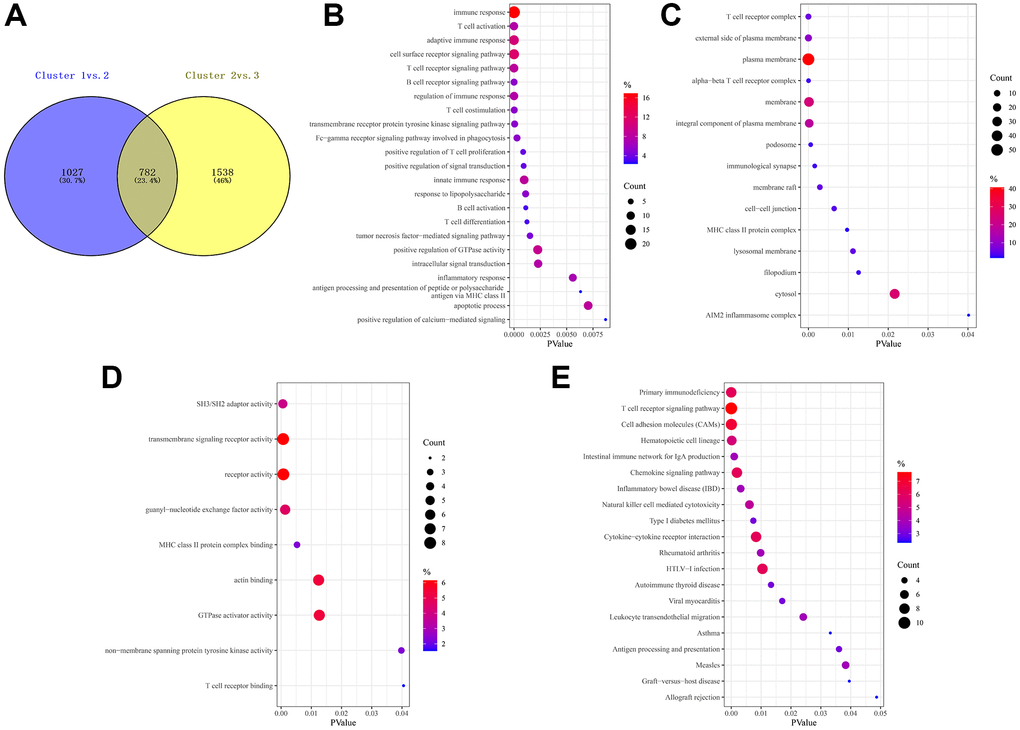
Figure 4.Prognostic DEGs between different FAM clusters. (A) 782 DEGs were identified across three FAM clusters using the R package “limma”. (B–E) Functional annotation for these DEGs using GO enrichment analysis, with the enrichment of GO-BP (B), GO-CC (C), GO-MF (D) and KEGG pathways of the 140 prognostic DEGs using univariate Cox regression analysis.