Submit an Article
Navigate
Home
Editorial Board
Editorial Policies
Current Volume
Archive
Scientific Integrity
Publication Ethics Statements
Interviews with Outstanding Authors
Newsroom
Sponsored Conferences
Podcast
Contact
Special Collections
Submit an Article
Online ISSN: 1945-4589
Research Paper
|
Volume 15, Issue 4
|
pp. 1158–1176
Comprehensive landscape of immune-based classifier related to early diagnosis and macrophage M1 in spinal cord injury
Back to article
Figure 4
(4 of 11)
−
100%
+
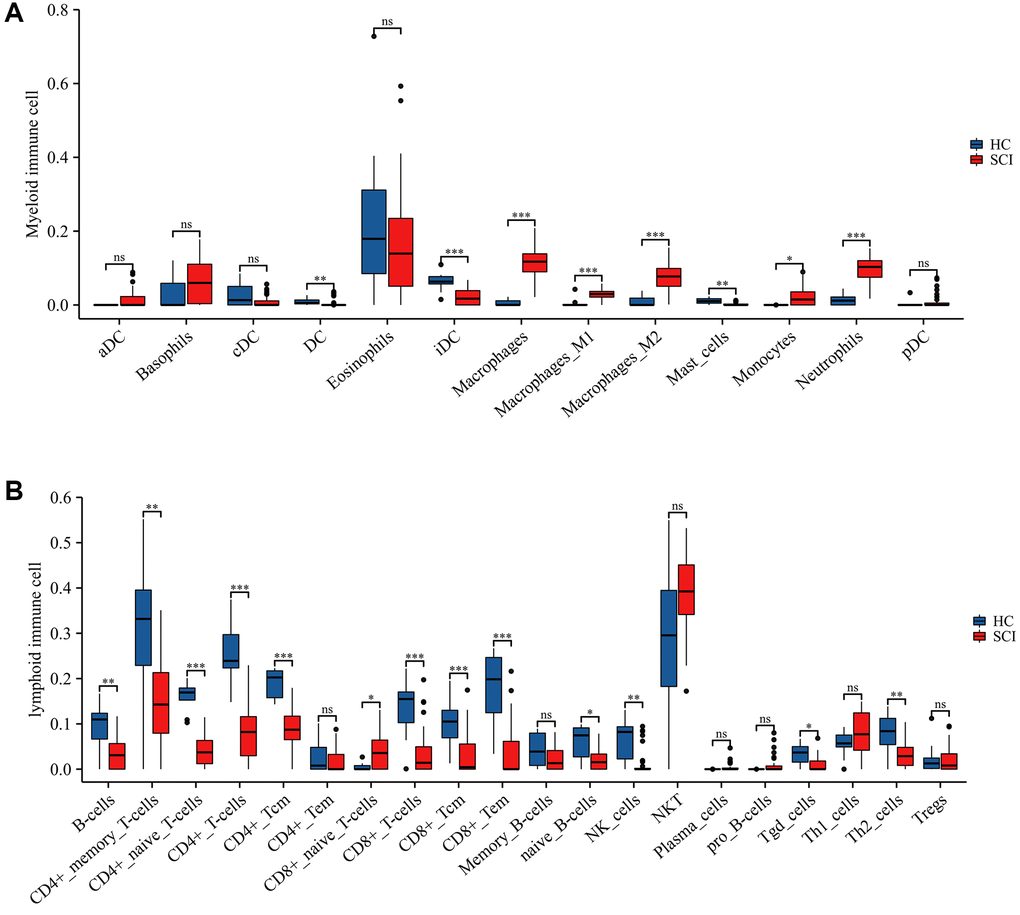
Figure 4.
Immune landscape between SCI and HC groups assessed using xCELL algorithm.
(
A
) Differences in myeloid immune cells; (
B
) Differences in lymphoid immune cells.
*
p
< 0.05;
**
p
< 0.01; and
***
p
< 0.001.