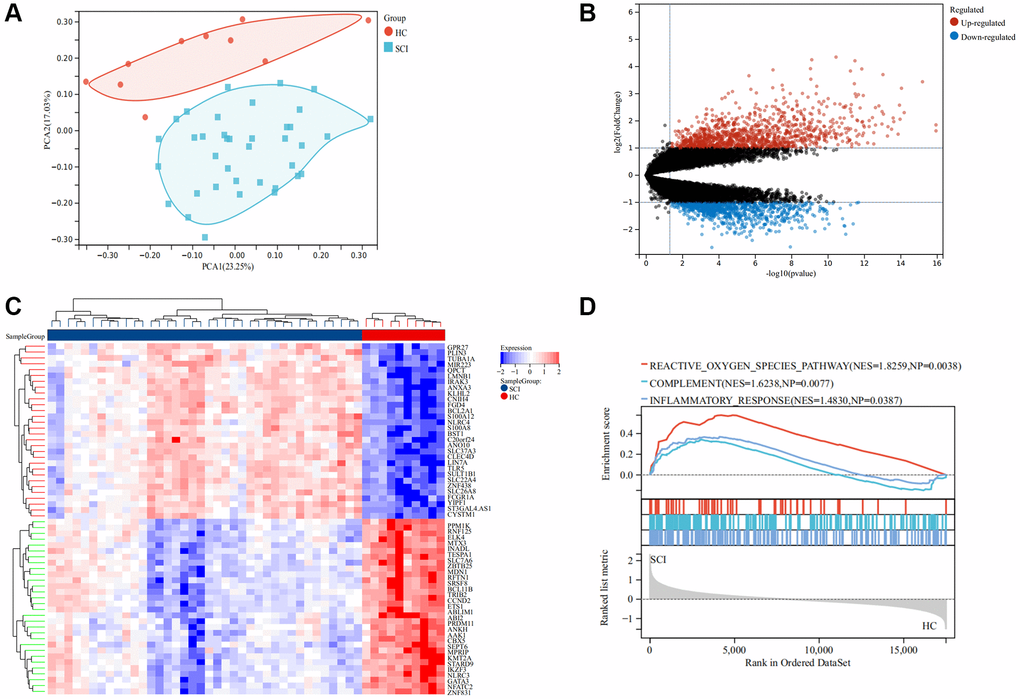
Figure 2.Screening for differentially expressed genes (DEGs) in SCI. (A) PCA analysis between the SCI and HC groups; (B) Volcano map of DEGs, red represent up-regulated genes and blue represent down-regulated genes; (C) Volcano map showing DEGs; (D) GSEA analysis between the SCI and HC groups.