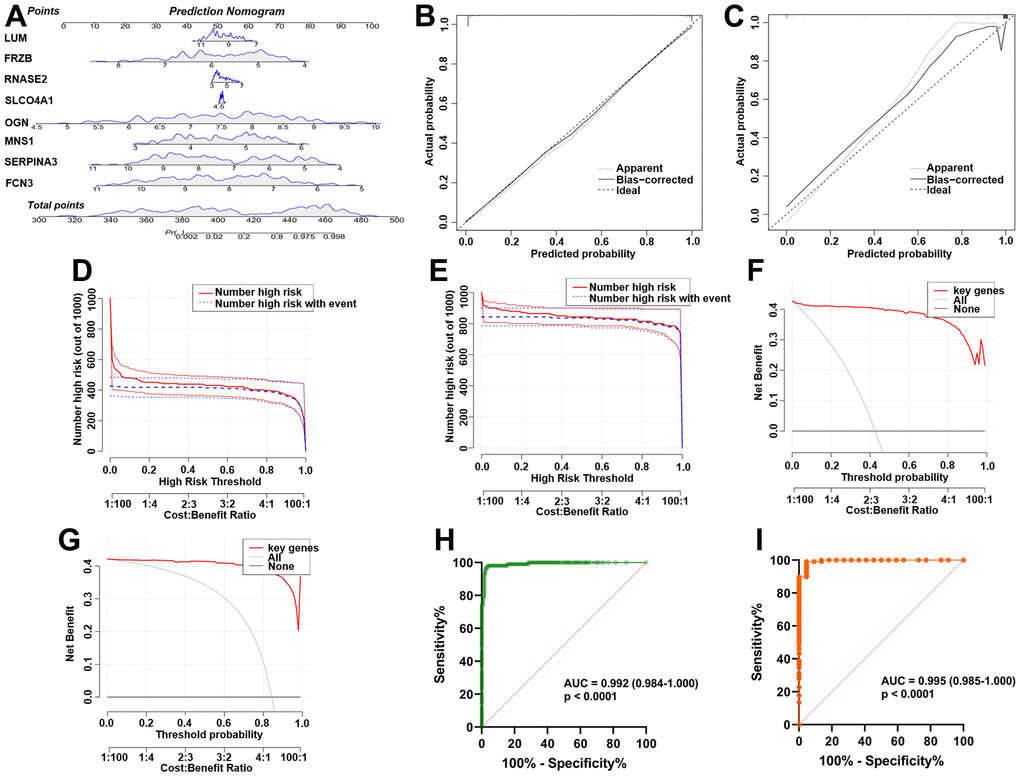
Figure 5.Establishment and verification of the ICM diagnostic signature and nomogram. (A) Eight predictive nomograms of genetic diagnosis. (B) Calibration curve in the training set. (C) Calibration curve in the testing set. (D) Decision curve analysis (DCA) in the training. (E) DCA in the testing set. (F) Clinical impact curve in the training set. (G) Clinical impact curve in the testing set. (H) ROC curve in the training set. (I) ROC curve in the testing set.