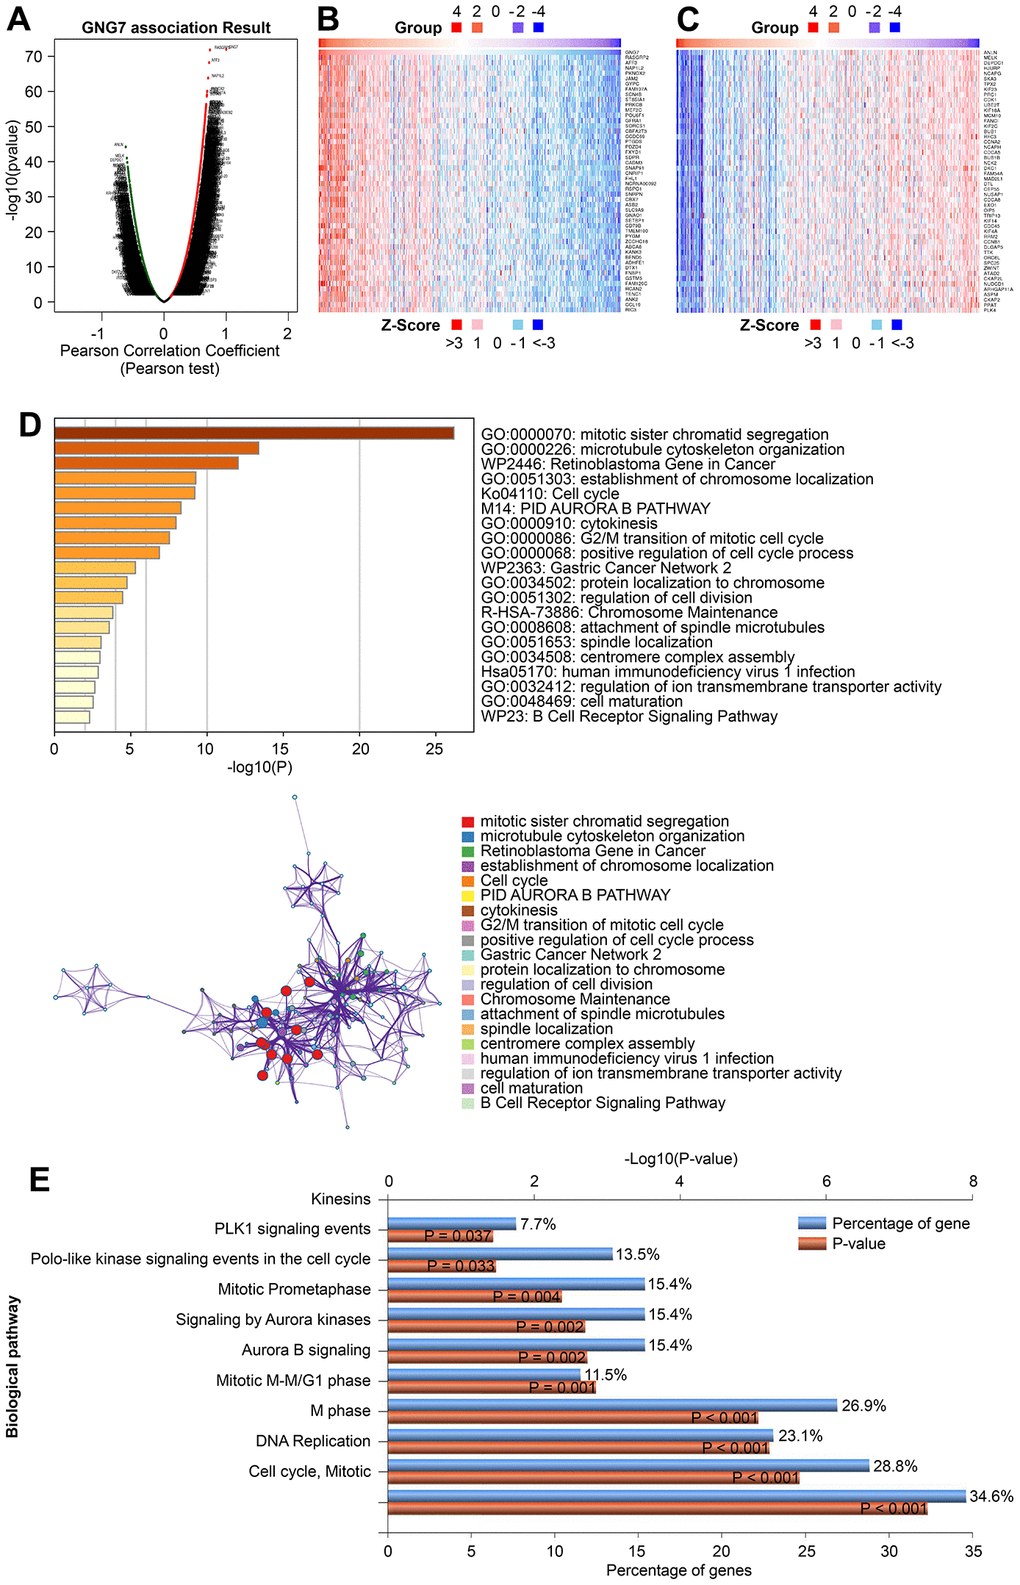
Figure 9.Enrichment analysis of GNG7-coexpressed genes in GC. (A) Volcano plot showing the correlations between GNG7 and genes differentially expressed in TCGA-STAD using Pearson’s test. (B, C) Heatmaps showing the top 50 genes positively and negatively correlated with GNG7 in TCGA-STAD. (D) Biological process enrichment analysis of GNG7-coexpressed genes in STAD performed using the Metascape database. (E) Biological pathway enrichment analysis of GNG7-coexpressed genes in STAD performed using the FunRich software. GC, gastric cancer; STAD, stomach adenocarcinoma.