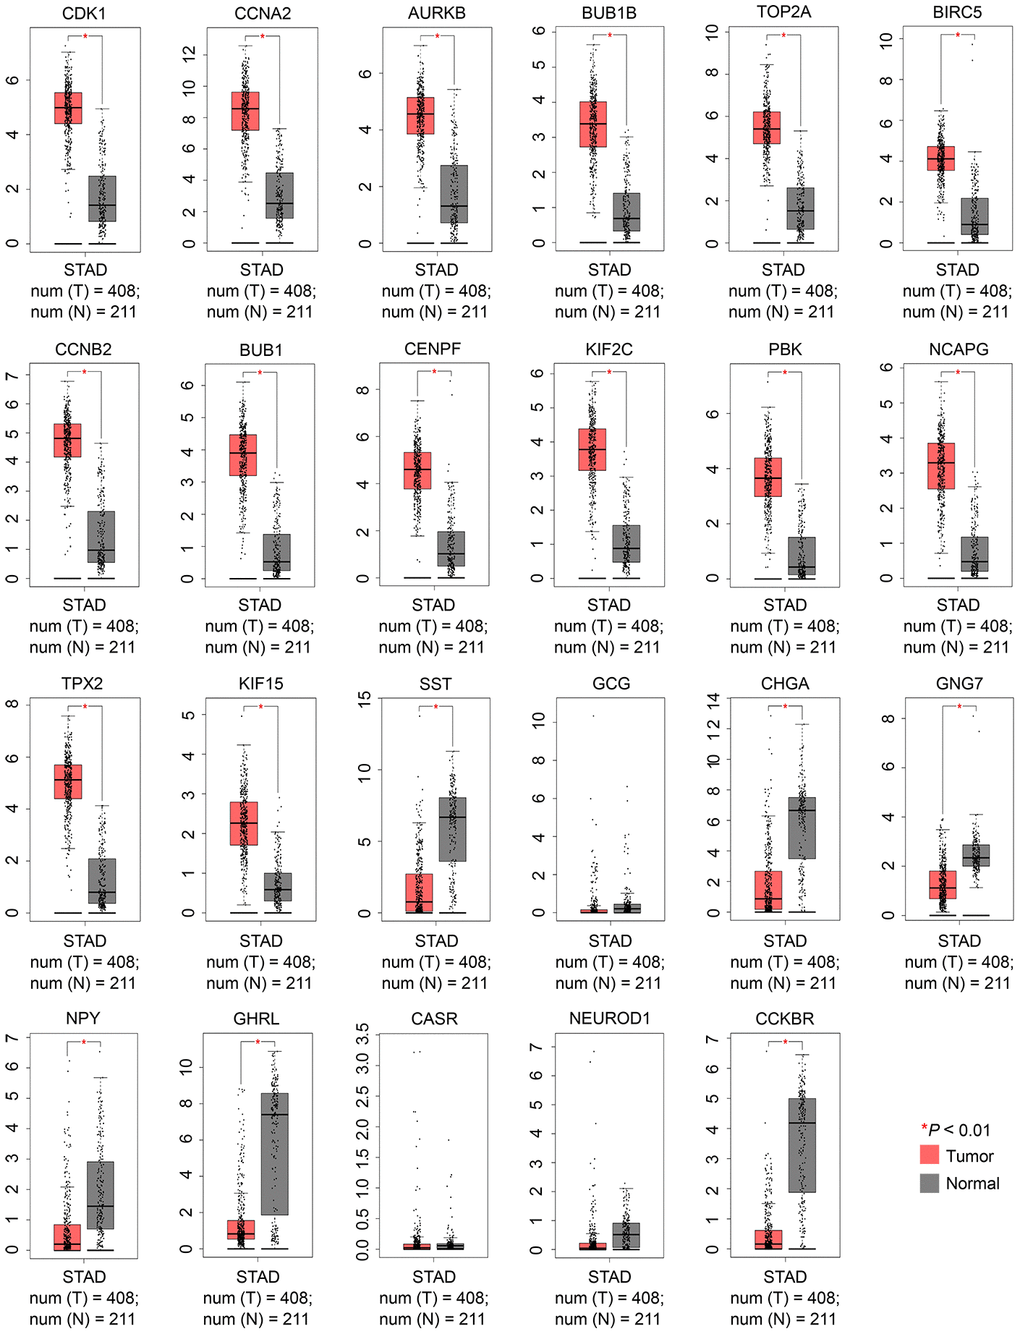
Figure 3.Validation of the expression levels of 23 candidate hub genes between GC and normal controls using the GEPIA2 database. |Log2FC|: 1 and P-value: 0.01 were set as the cutoff. FC, fold change; GC, gastric cancer; GEPIA, Gene Expression Profiling Interactive Analysis. N, normal; STAD, stomach adenocarcinoma; and T, tumor.