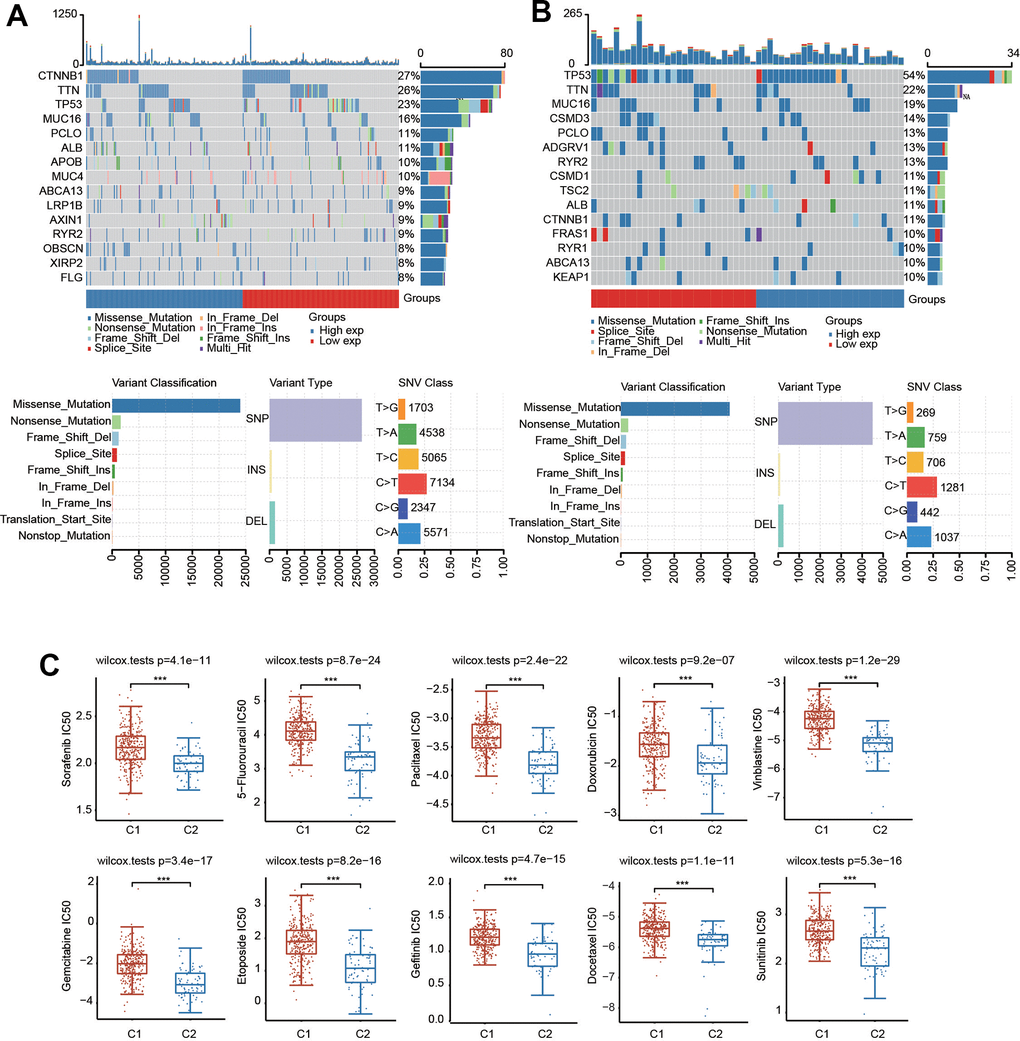
Figure 6.Mutational landscape and drug sensitivity of two clusters. (A) The landscape of mutation profiles in C1. (B) The landscape of mutation profiles in C2. Variant classification, variant types and SNV classification are shown. (C) Comparison of drug sensitivity in the two clusters. ***p < 0.001.