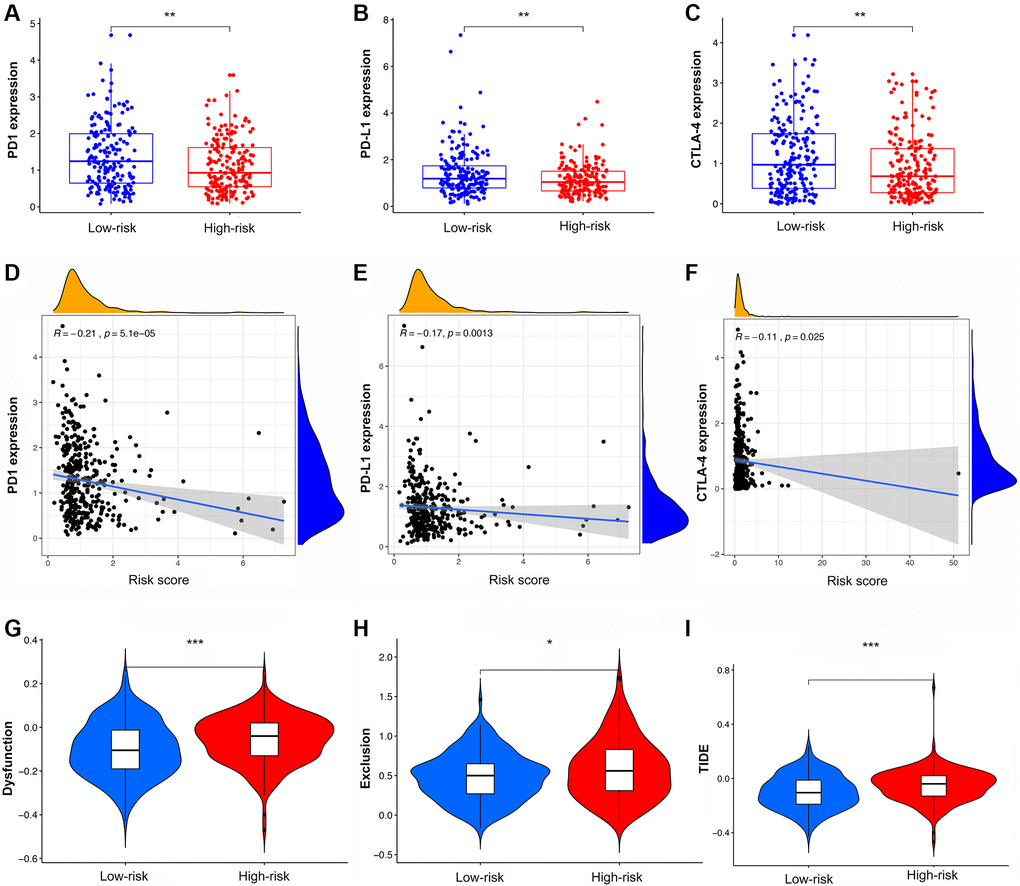
Figure 8.The analysis of TIDE score and expression of immune checkpoints in high- and low-risk groups. (A–C) The expression of PD1, PD-L1, and CTLA4 in different risk groups. (D–F) The co-expression patterns between immune checkpoints and risk scores. (G–I) The scores of immune dysfunction, immune exclusion, and TIDE in different risk groups.