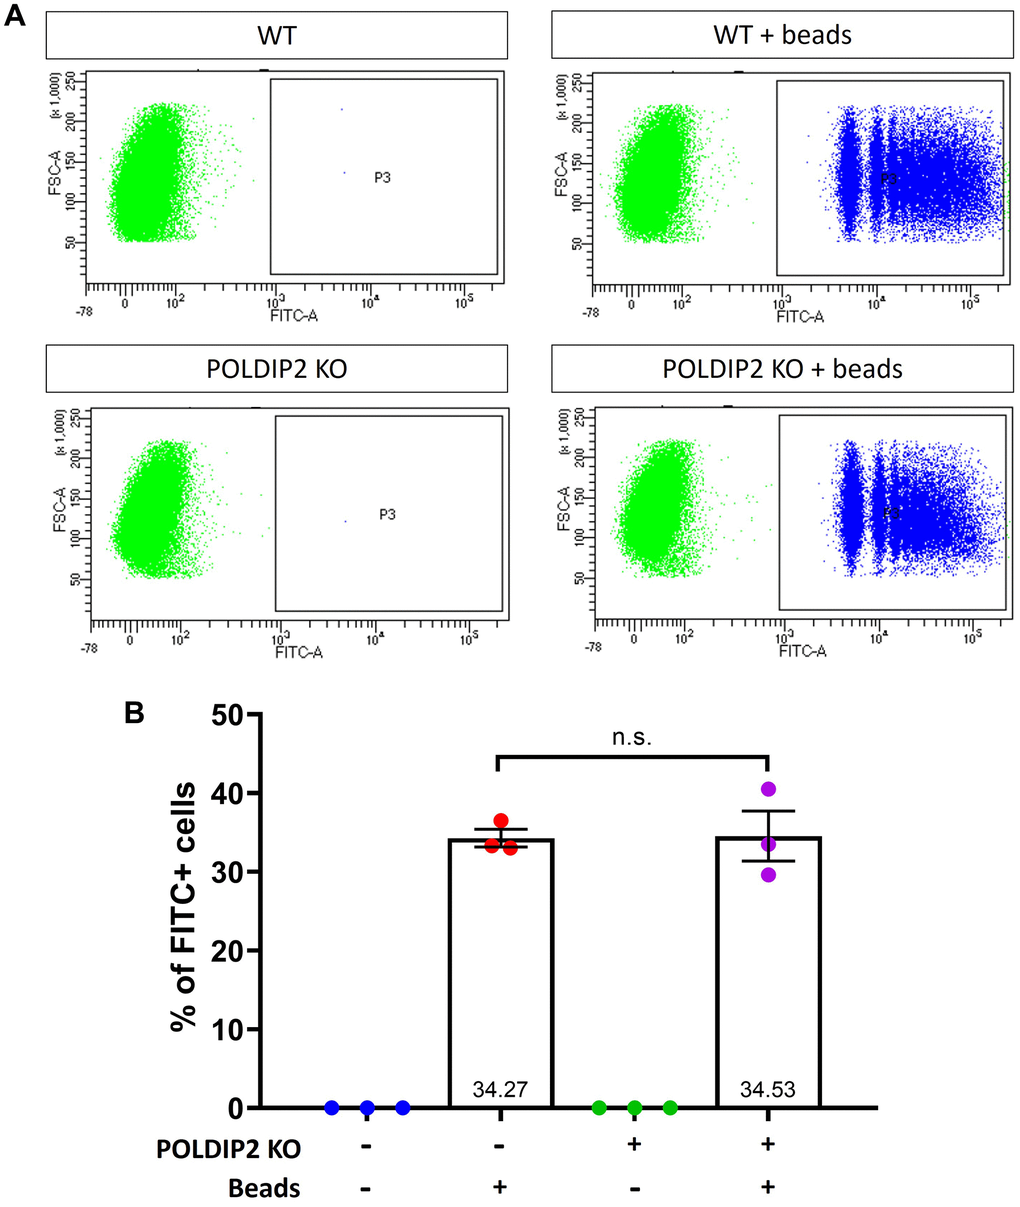
Figure 2.POLDIP2 KO cells show normal levels of phagocytosis. (A) Flow cytometry analysis of phagocytosis in WT and POLDIP2 KO treated with or without FITC+ fluospheres. (B) Pooled quantification results of n=3 biological repeats. Error bars represent SEM. n.s. not significant.