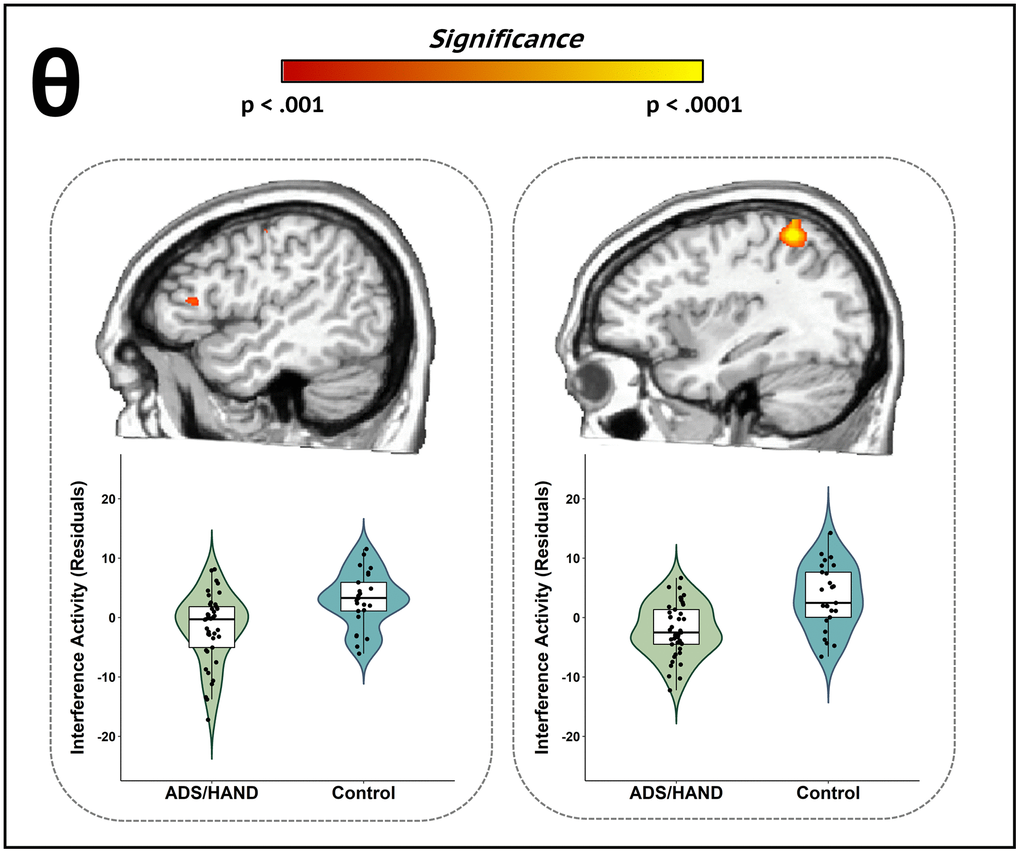
Figure 3.Participants with ADS or HAND exhibited aberrant theta interference activity during attentional processing compared to healthy controls. Whole-brain group difference maps of theta interference activity are displayed accompanied by violin plots for the peak voxel in each significant cluster. Group differences (p < .001, corrected) were revealed in left inferior frontal (left) and left superior parietal cortices (right). Residuals of amplitude values controlling for age are presented below each corresponding brain slice.