Submit an Article
Navigate
Home
Editorial Board
Editorial Policies
Current Volume
Archive
Scientific Integrity
Publication Ethics Statements
Interviews with Outstanding Authors
Newsroom
Sponsored Conferences
Podcast
Contact
Special Collections
Submit an Article
Online ISSN: 1945-4589
Research Paper
|
Volume 14, Issue 23
|
pp. 9647–9667
The pattern and magnitude of T cell subsets reconstitution during ten years of ART with viral suppression in HIV-infected patients
Back to article
Figure 2
(2 of 2)
−
100%
+
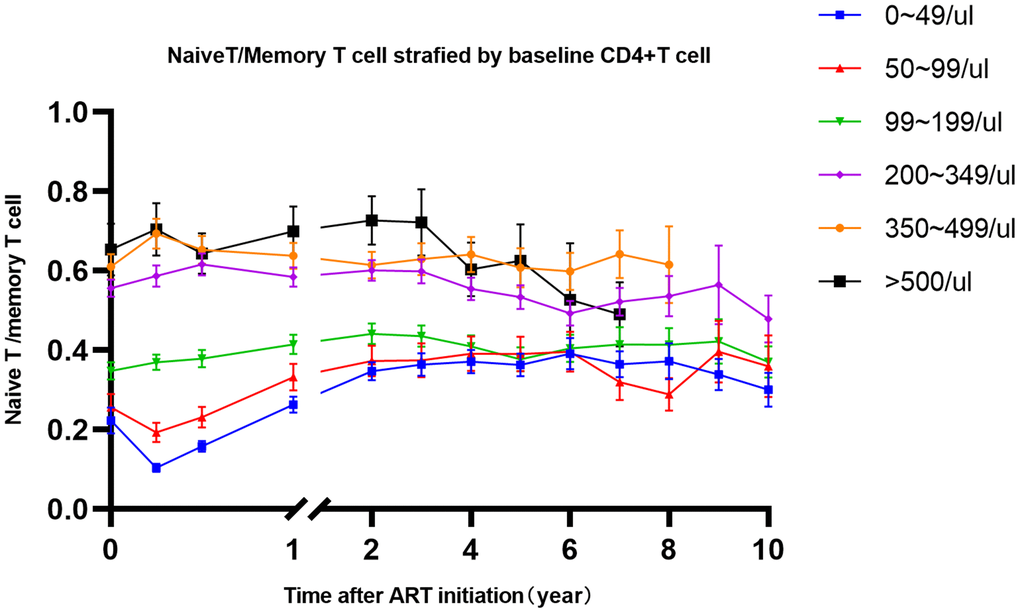
Figure 2.
The trends of naïve/memory T cell change after 10-year of ART stratified by baseline CD4+T cells.
Notes: Different color represents different level of baseline CD4+T cell counts, which shown in top right corner.