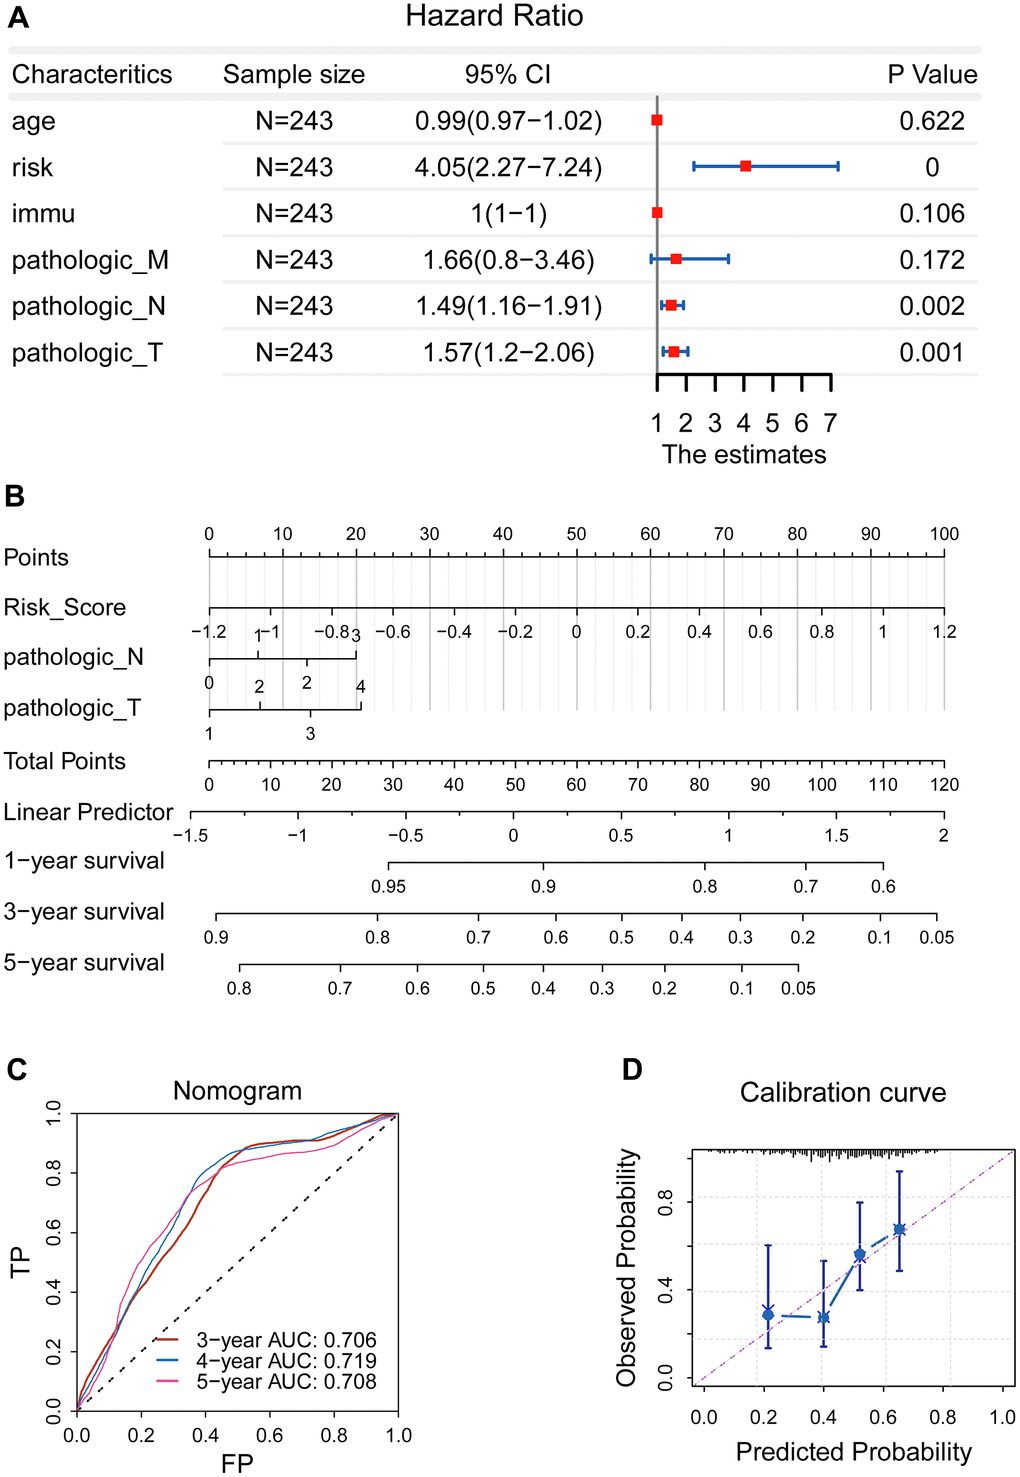
Figure 4.Development of a prognostic nomogram. (A) Pathological N, the pathological T, and the newly-established signature were selected as effective indicators. (B) A nomogram was constructed. (C) The ROC curve demonstrated an elevated forecasting performance, and five-year AUC value was 0.708 (D) Calibration curve revealed that the calculated probability line was highly compatible with observed probability line.