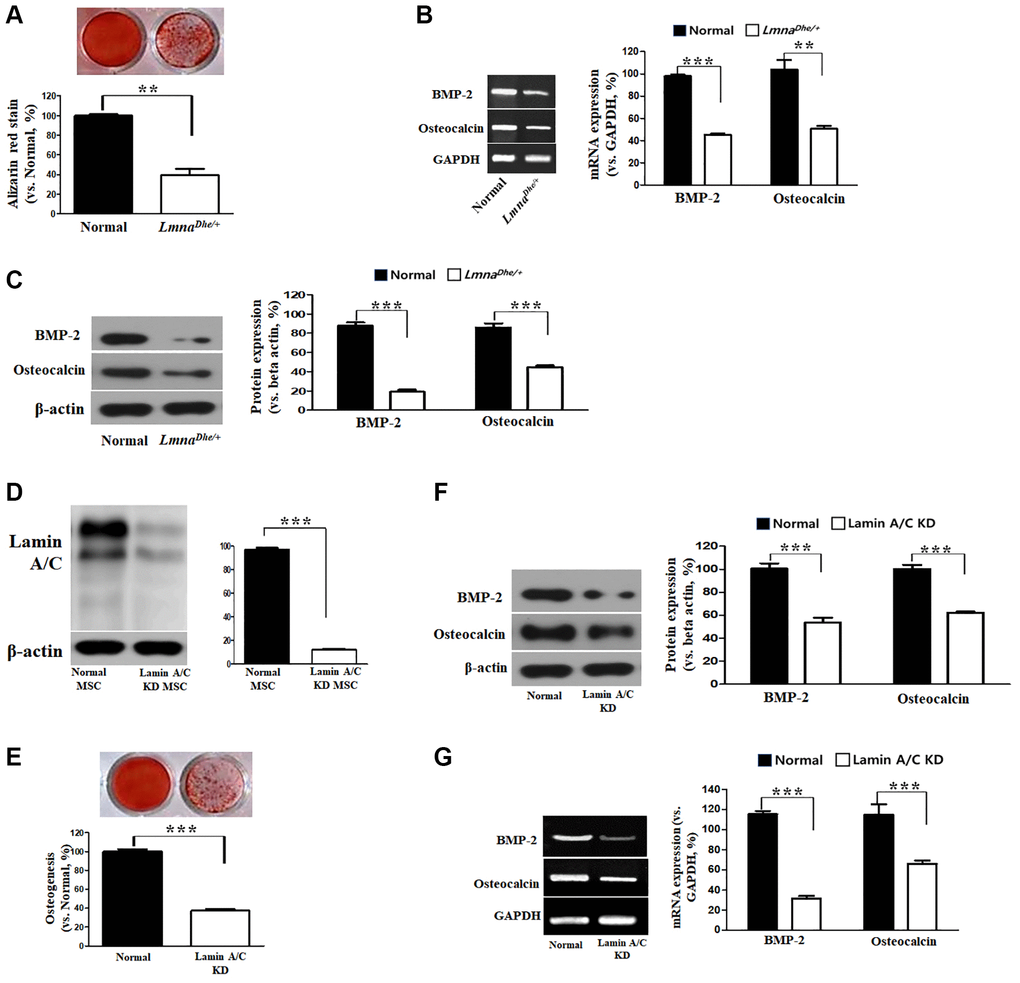
Figure 2.Osteogenic analysis in Lmna dysfunction MSCs compared to normal MSCs. (A) Alizarin Red staining. (B) Expression of osteogenic genes in Lmna dysfunction MSCs compared with normal MSCs. (C) Expression of osteogenic proteins in Lmna dysfunction MSCs compared with normal MSCs. (D) Lamin A/C knock down by siRNA. and (E) Alizarin Red staining. (F) Expression of osteogenic proteins in Lmna dysfunction MSCs compared with normal MSCs. (G) Expression of osteogenic genes in Lmna dysfunction MSCs compared with normal MSCs. ***p < 0.001 indicates a significant difference from the normal MSCs.