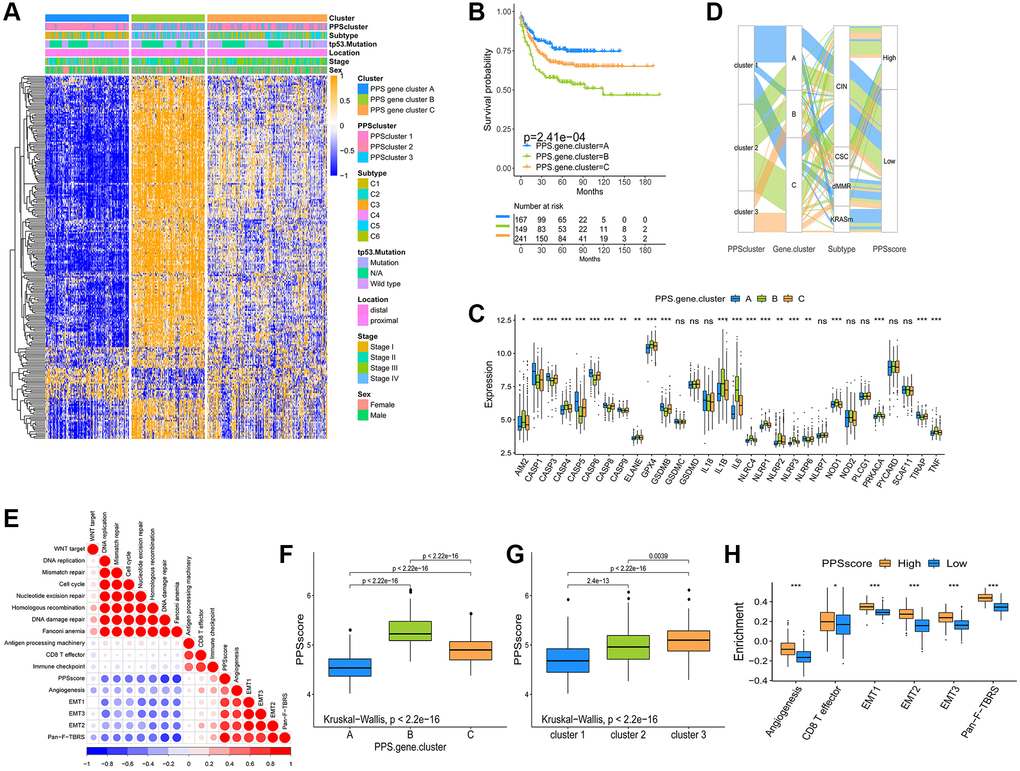
Figure 4.Construction and analysis of pyroptosis signatures. (A) Unsupervised clustering of overlapping pyroptosis phenotype-related genes in GSE39582 cohort to classify patients into three genomic subtype (PPS gene cluster A–C). Clinicopathological information such as tumor subtype, tp53 mutation, tumor location, tumor stage, and gender was used as patient annotations. (B) The survival curves of the pyroptosis phenotype-related gene signatures were shown using the Kaplan-Meier plotter. (C) The expression of 30 PRGs in three gene clusters (*P < 0.05; **P < 0.01; ***P < 0.001). (D) The changes of PPSclusters, PPS gene clusters, tumor molecular subtypes and PPSscore were shown in the Alluvial diagram. (E) Correlations between PPSscore and the other gene signatures in GSE39582 CC cohort using Spearman analysis. Negative correlation was marked with blue and positive correlation with red. (F, G) The Kruskal-Wallis test was used to compare the statistical difference in PPSscore among three gene clusters and three PPSclusters. (H) Differences in stroma-activated pathways between high and low PPSscore groups (*P < 0.05; **P < 0.01; ***P < 0.001).