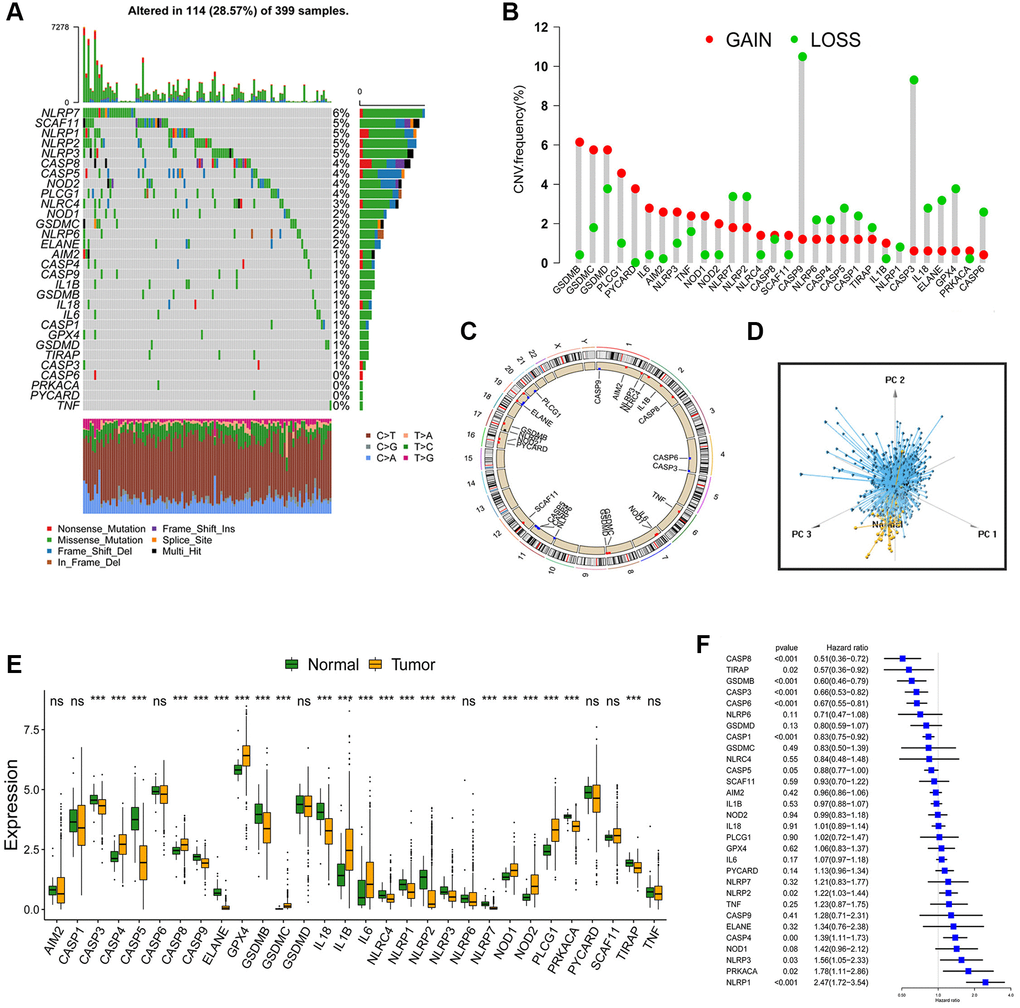
Figure 1.Landscape of genetic and expression variation of PRGs in CC. (A) Total of 114 of the 399 CC patients experienced genetic alterations of PRGs, with a frequency of 28.57%. The upper barplot showed the tumor mutational burden. The number on the right indicated the mutation frequency in each gene. The stacked barplot below showed fraction of conversions in each sample. Each column represented every individual patient. (B) The histogram showed the CNV variation frequency of PRGs. The height of the column represented the alteration frequency. The deletion frequency, green dot; The amplification frequency, red dot. (C) The location of CNV alteration of PRGs on 23 chromosomes. (D) Principal component analysis for the expression profiles of 30 PRGs to distinguish tumors from normal samples. Tumors were marked with blue and normal samples were marked with yellow. (E) The difference of mRNA expression levels of 30 PRGs between normal and CC samples (*P < 0.05; **P < 0.01; ***P < 0.001). (F) The univariate Cox regression model was used to analyze the prognosis of 30 PRGs in 6 CC cohorts. Hazard ratio >1 indicated risk factors for survival, and hazard ratio <1 indicated protective factors for survival.