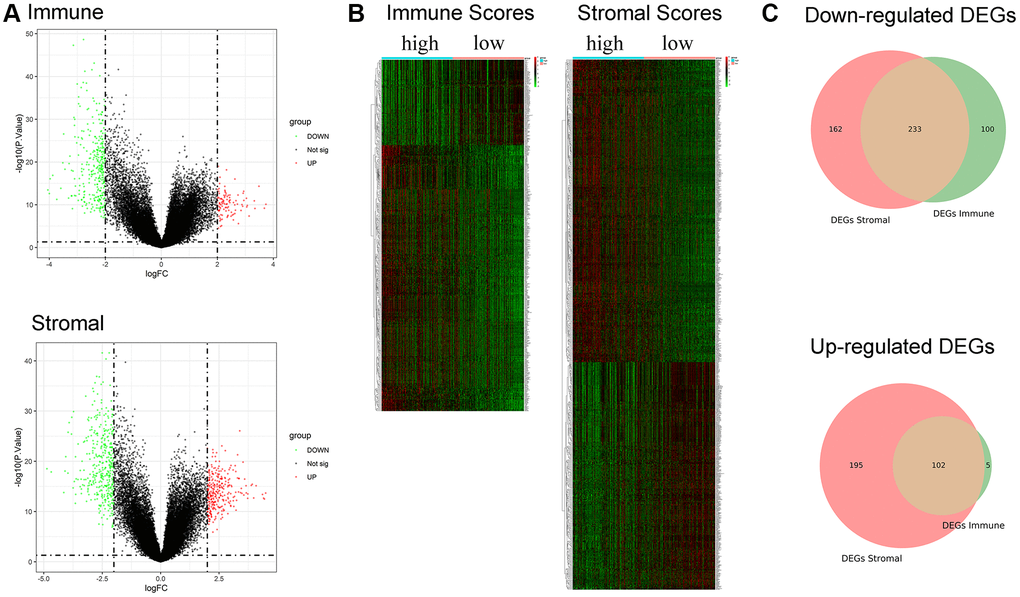
Figure 3.Identification of DEGs based on immune score and stromal score. (A) Volcano plot of DEGs from the low/high immune and stromal score groups. Note: Genes with p < 0.05 are shown in red (FC > 2) and green (FC < −2). Black plots represent the remaining genes (those with no significant difference). (B) Heatmap of DEGs from the low/high immune and stromal score groups. (C) Venn plot for common up- and downregulated DEGs in the stromal and immune score groups.