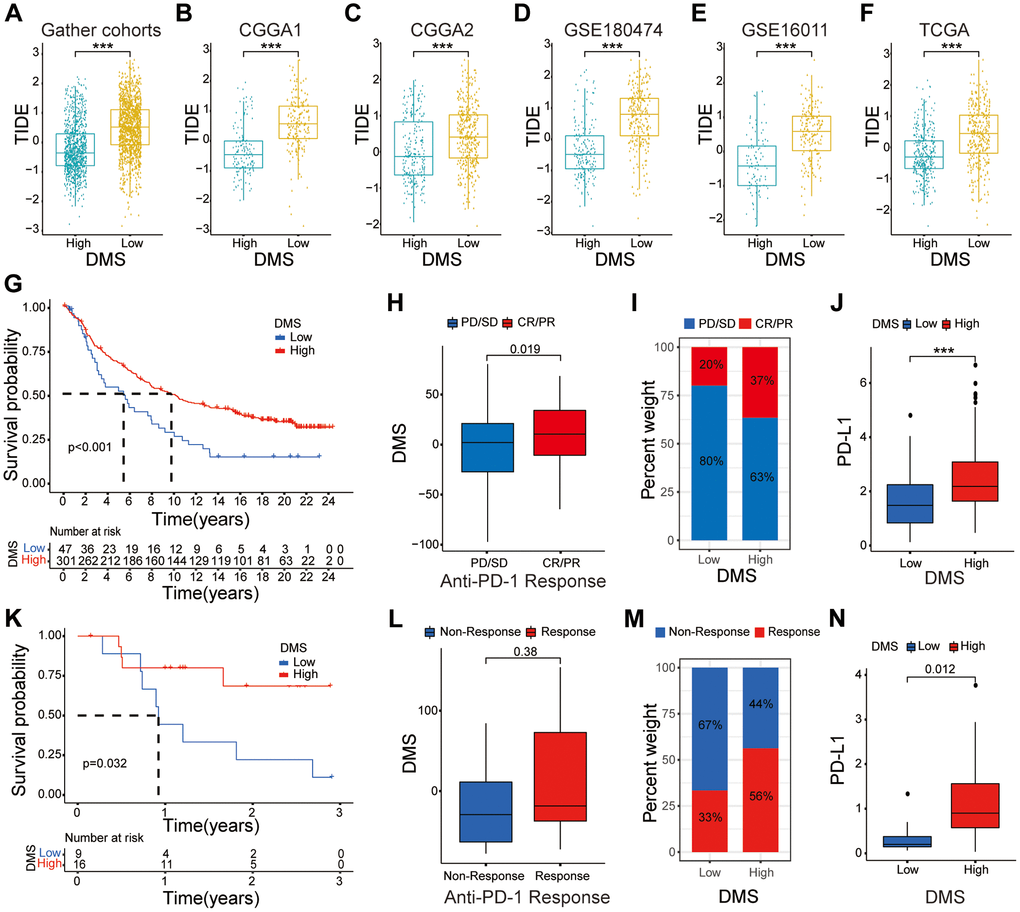
Figure 6.The relationship between DMS and response to anti-PD-1/L1 immunotherapy. (A–F) Distribution of TIDE scores between high and low DMS subgroups in the gather glioma cohorts, as well as CGGA1, CGGA2, GSE180474, GSE16011 and TCGA datasets, respectively. (G–I) Survival analyses with the OS (G), clinical response to anti PD-1 immunotherapy (H), proportion of patients responding to PD-1 blockade immunotherapy (I), differences in PD-L1 expression (J) based on the low and high DMS subgroups in the IMvigor210 cohort. (K–N) Survival analyses with the OS (K), clinical response to anti PD-1 immunotherapy (L), proportion of patients responding to PD-1 blockade immunotherapy (M), differences in PD-L1 expression (N) based on the low and high DMS subgroups in the GSE78220 cohort. Note: ns P > 0.05; *P < 0.05; **P < 0.01; ***P < 0.001.