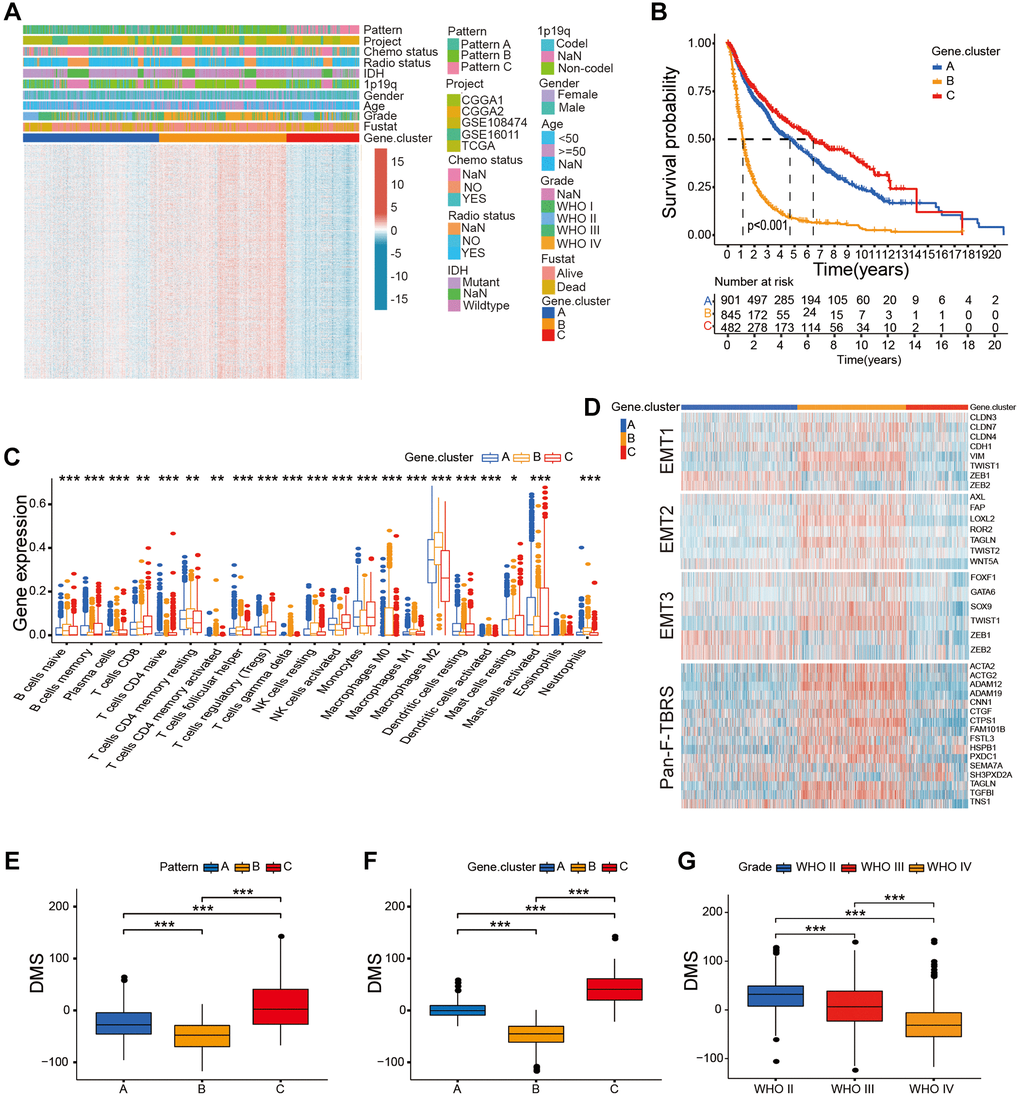
Figure 4.Construction of DMS in the gather glioma cohort. (A) Unsupervised clustering of the overlapping DNA methylation-related genes in the gather glioma cohorts. (B) Survival analysis of glioma patients belonging to the three DNA methylation-related gene clusters; P < 0.001. (C) The proportion of immune cell types in the glioma and the transcriptome traits in the three DNA methylation-related gene clusters. (D) The differences in the expression of genes related to the activated stromal pathways including EMT1, EMT2, EMT3, and pan-F-TBRS between three DNA methylation-related gene clusters. (E–G) Box-plots shows the DMS for DNA methylation regulator patterns (E), gene clusters (F), different glioma grades groups (G), P < 0.001. Note: ns P > 0.05; *P < 0.05; **P < 0.01; ***P < 0.001.