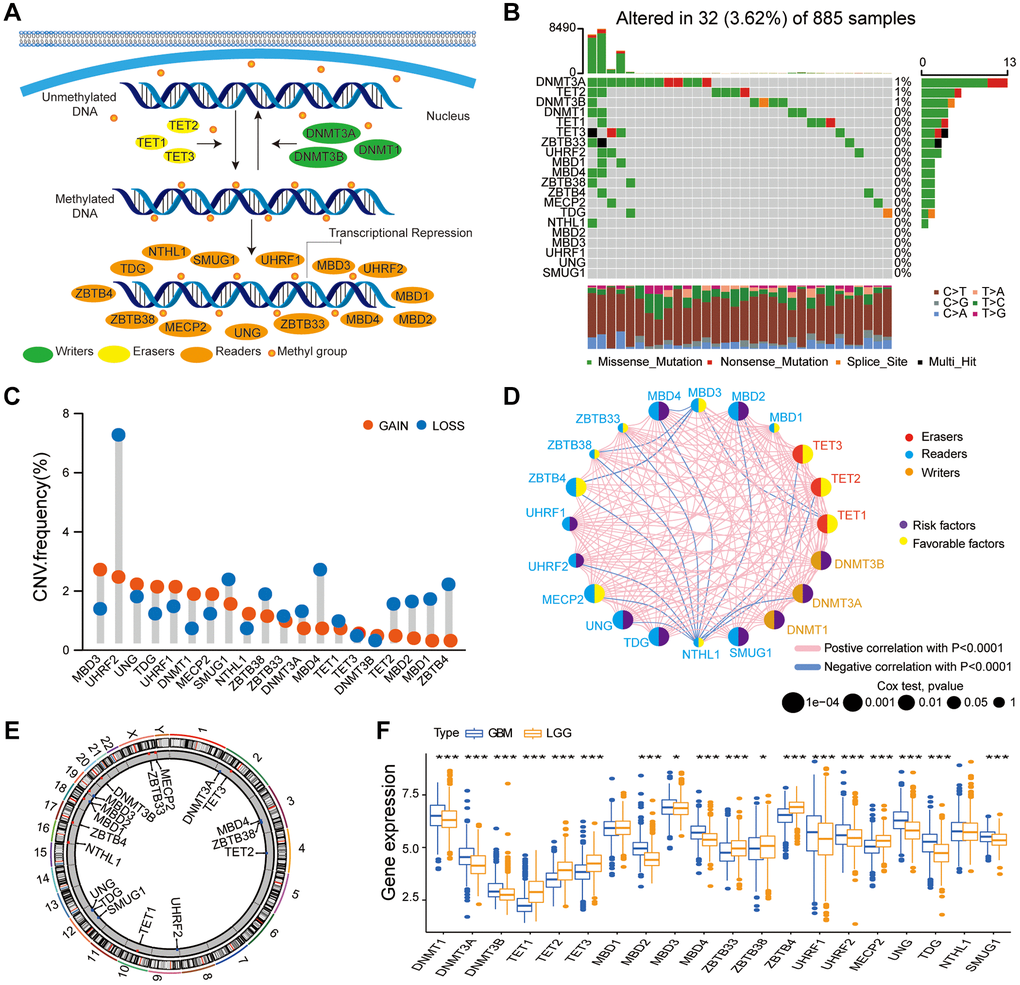
Figure 1.Multi-omics landscape of the DNA methylation regulators in glioma. (A) The summary of 20 DNA methylation regulators and their molecular functions in mediating the dynamic reversible process of DNA methylation. (B) Mutation frequency of the 20 DNA methylation regulators based on TCGA glioma dataset. Each column represents a single glioma samples. (C) The CNV frequency of DNA methylation regulators based on the TCGA glioma dataset. Note: gain, red; loss, blue. (D) PPI network of the 20 DNA methylation regulators. Size of the node denotes the number of proteins. (E) Circos plots illustrating the chromosomal locations of the CNV alternations in 20 DNA methylation regulatory genes. (F) Boxplot shows the expression levels of the 20 DNA methylation regulators in patients with LGG and GBM bases on the gather glioma cohort. Note: ns P > 0.05; *P < 0.05; **P < 0.01; ***P < 0.001.