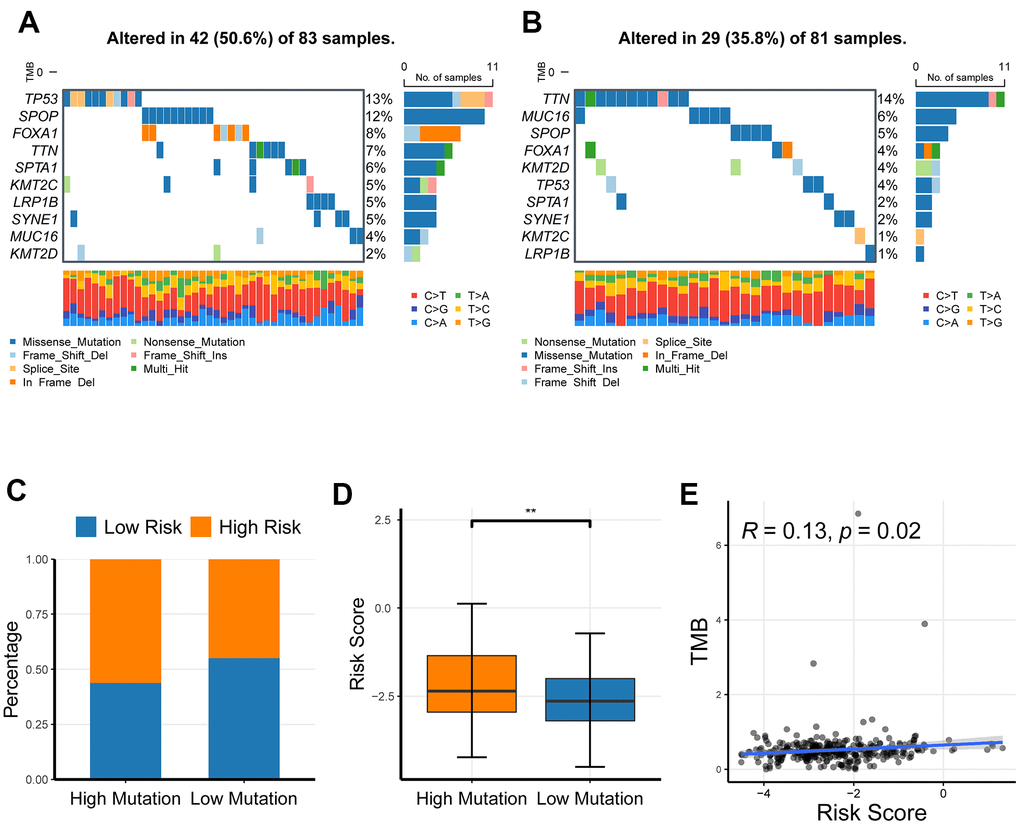
Figure 8.The profiling of somatic nucleotide variation for PRAD patients of different risk groups. (A, B) The waterfall plot of nucleotide variation rate in high-risk group and low-risk group. (C, D) The bar plot and box plot analyses of risk scores in the high-mutation group and low-mutation group. (E) The correlation of tumor mutation burden and risk score. *P <0.05, ** P <0.01, ***P<0.001.