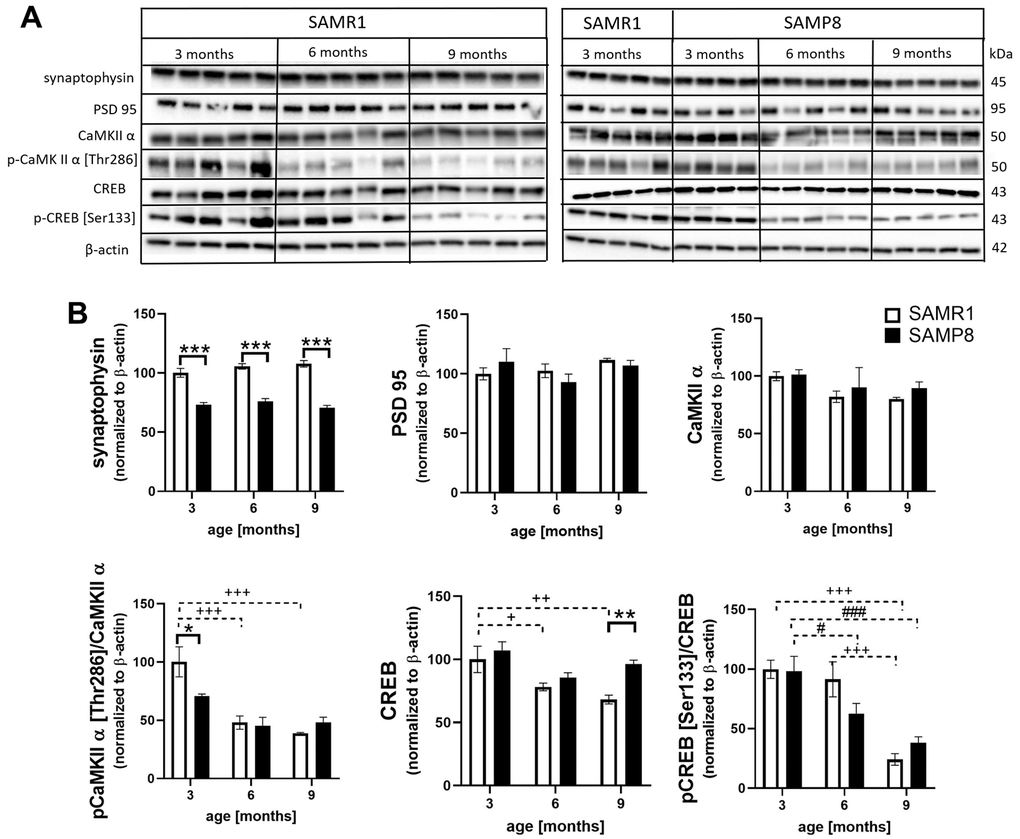
Figure 8.Decreased markers of synaptic plasticity in the hippocampi of SAMP8 (A) western blots and (B) their quantification. Data are mean ± SEM, analyzed by 2-way ANOVA with Bonferroni post test. Significance is *P <0.05, **P < 0.01 and ***P < 0.001. * SAMP8 compared to SAMR1, + age-dependent changes in SAMR1, and # age-dependent changes in SAMP8. n = 4-5 mice per group.