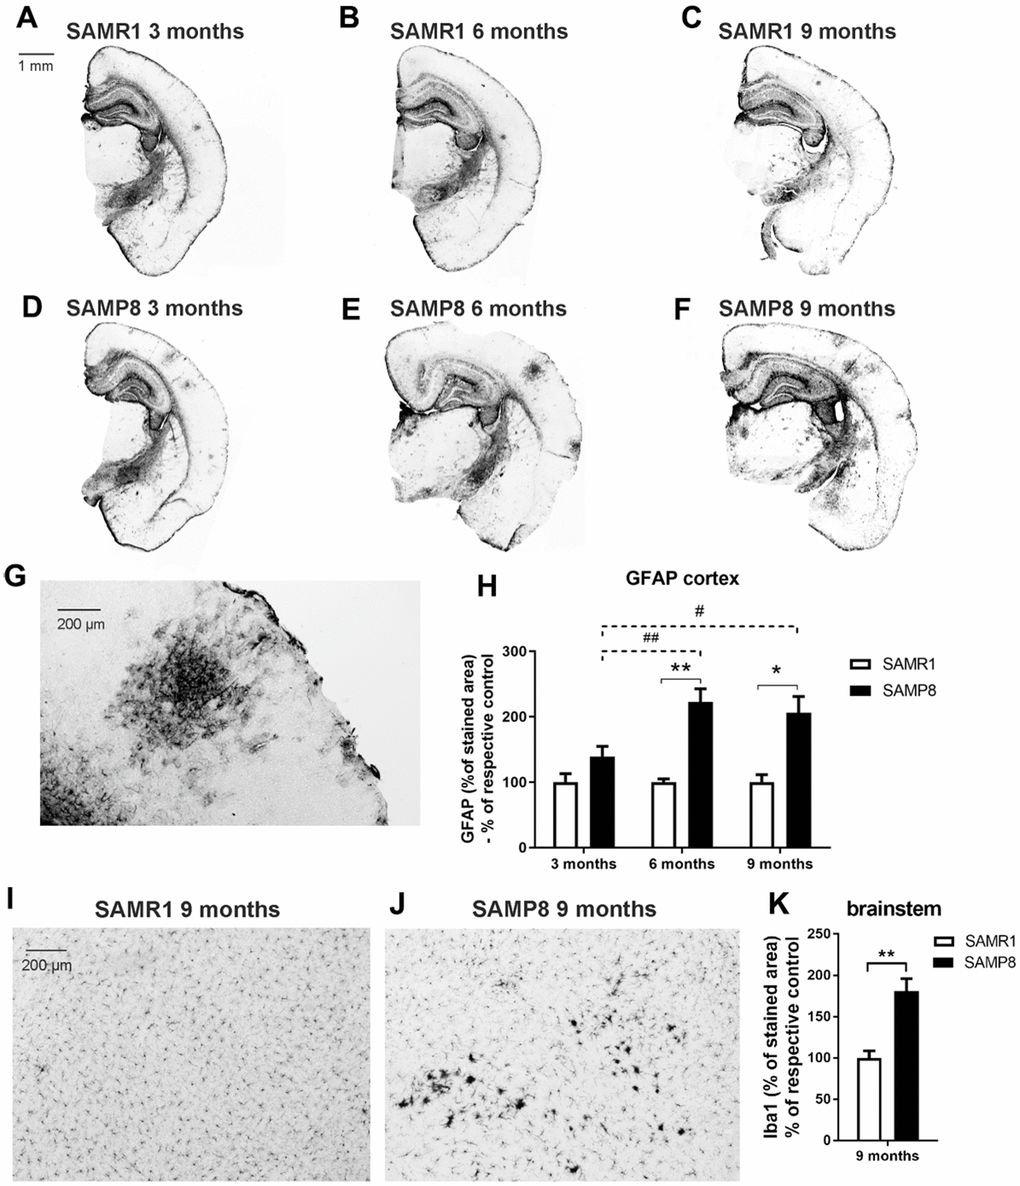
Figure 5.Increased neuroinflammation in the brains of SAMP8 mice: (A–G) marker of reactive astrocytes GFAP in the cortex, and (H) its quantification, and (I, J) marker of microglia Iba1 in the brainstem and (K) its quantification. Data are mean ± SEM, analyzed by 2-way ANOVA with Bonferroni post test (GFAP) or t-test (Iba1). Significance is *P < 0.05 and **P < 0.01. * SAMP8 compared to SAMR1, + age-dependent changes in SAMR1, and # age-dependent changes in SAMP8. n = 4-5 mice per group, 8-10 sections per brain.