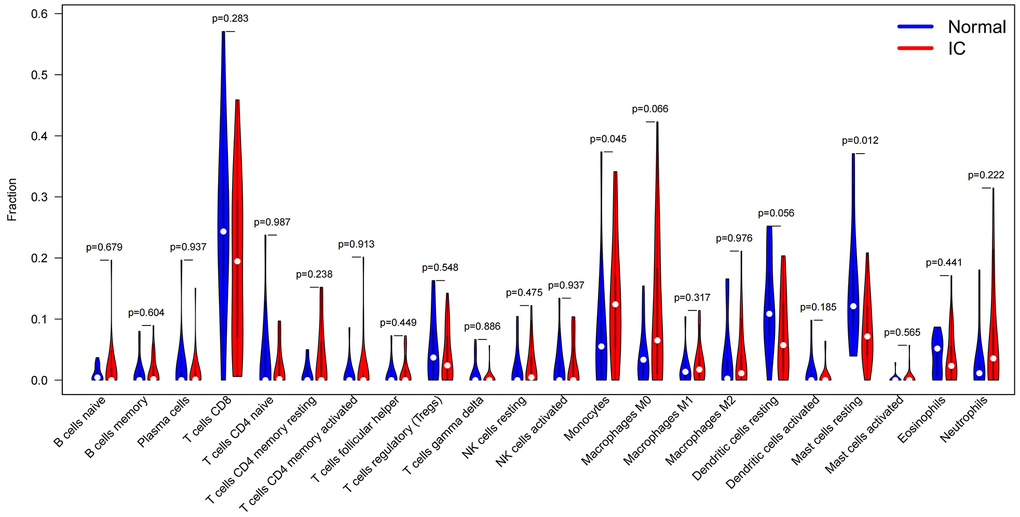
Figure 3.Immune-infiltration analysis of GEO datasets of IC/BPS patients by the CIBERSORTx online tool. Violin Plot and were used to compare the immune cell score difference between IC/BPS and normal bladder tissues (Blue indicates normal bladder tissues; red indicates IC/BPS bladder tissues. Wilcoxon signed rank test was used to compare and calculate the statistical p-value).