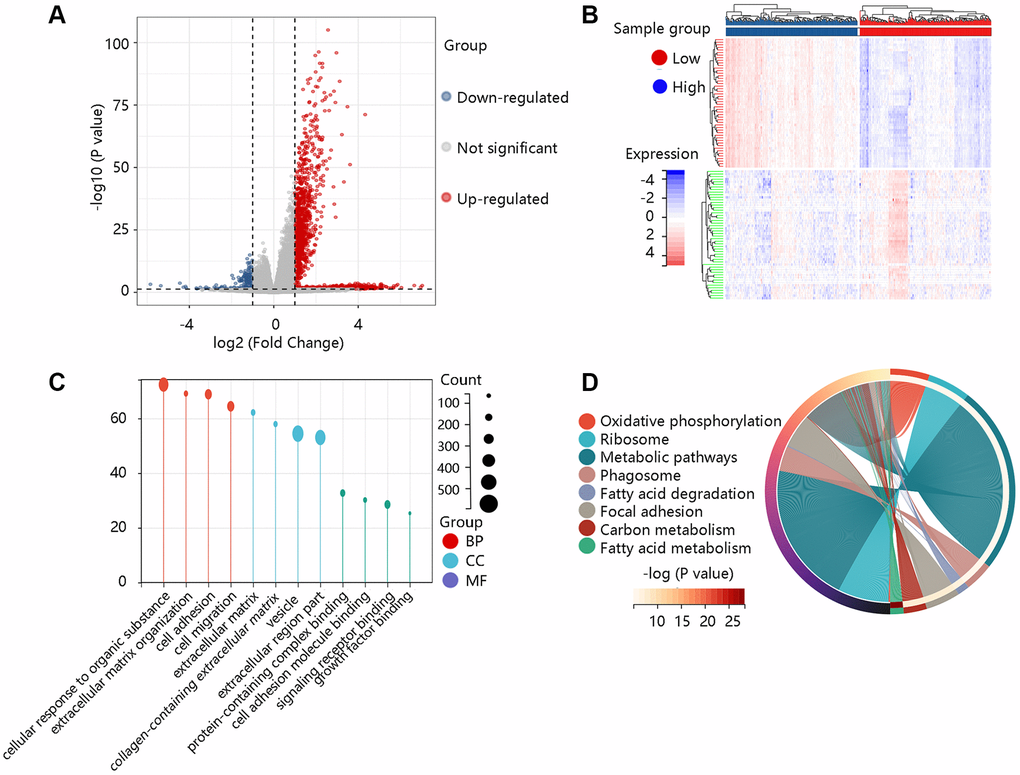
Figure 7.Functional enrichment analysis of the differentially expressed genes (DEGs). (A) The volcano plot exhibited the DEGs between high- and low- COL1A2 expression groups. (B) The heat map showed the top 50 significant DEGs. (C) The gene ontology annotations of the DEGs. (D) The KEGG pathway enrichment of the DEGs.