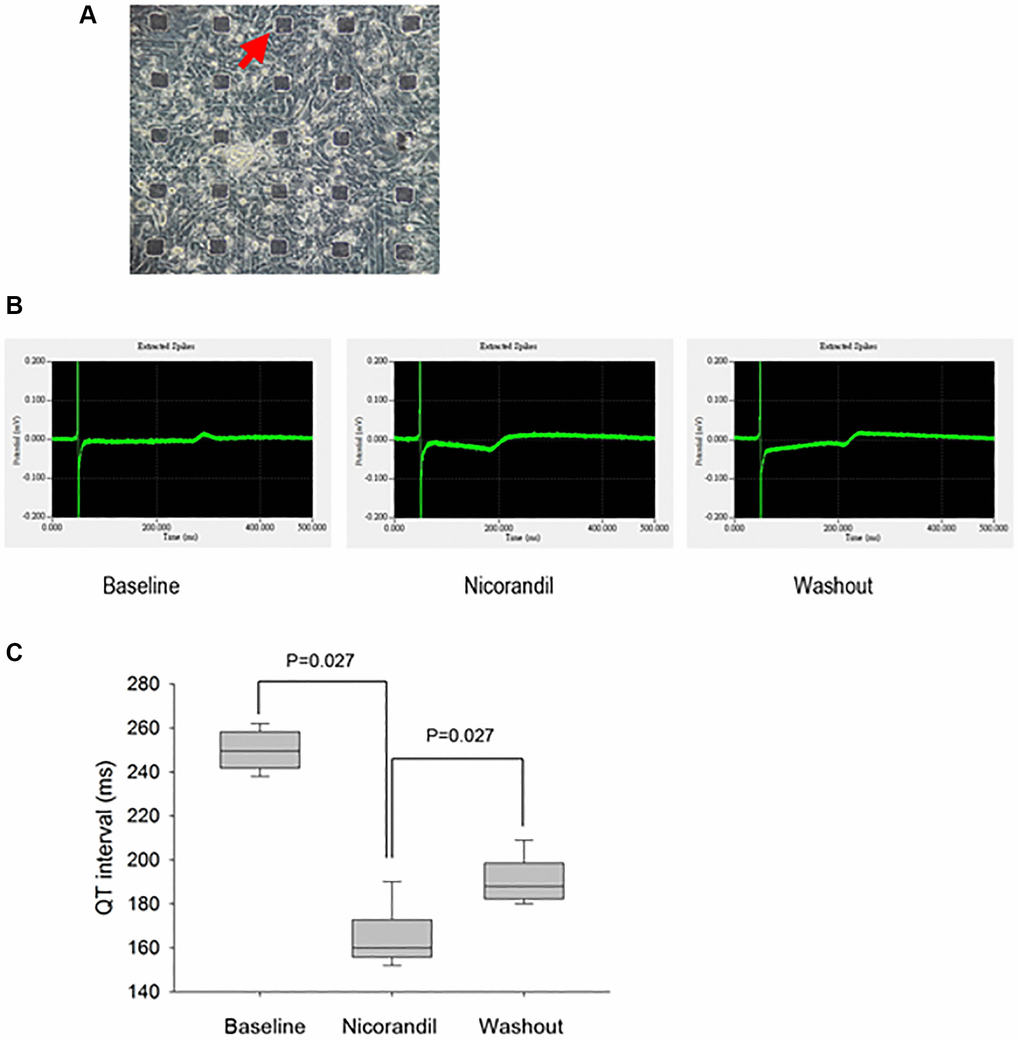
Figure 5.Generation and analysis of electrograms from human iPSC-CM cultures show nicorandil shortens QT interval of iPSC-CMs. (A) Phase-contrast images show an overview of cell morphology of iPSC-CM cultures on top of the micro electrode array (black rectangular dots; red arrow). (B) QT interval in electrogram is a gross phenotype of cellular action potential duration. The electrogram or field potential was recorded from the microelectrodes with iPSC-CMs cultured on top of them. Because the end of the T wave is not prominent, the QT interval is measured as the interval from the Q wave to the peak P wave. Shortening of QT interval is noted after nicorandil (100 uM) stimulation. (C) Summary data of QT interval before and after nicorandil stimulation are shown (n = 6). Data represent mean ± SD; p < 0.05 before versus after nicorandil stimulation.