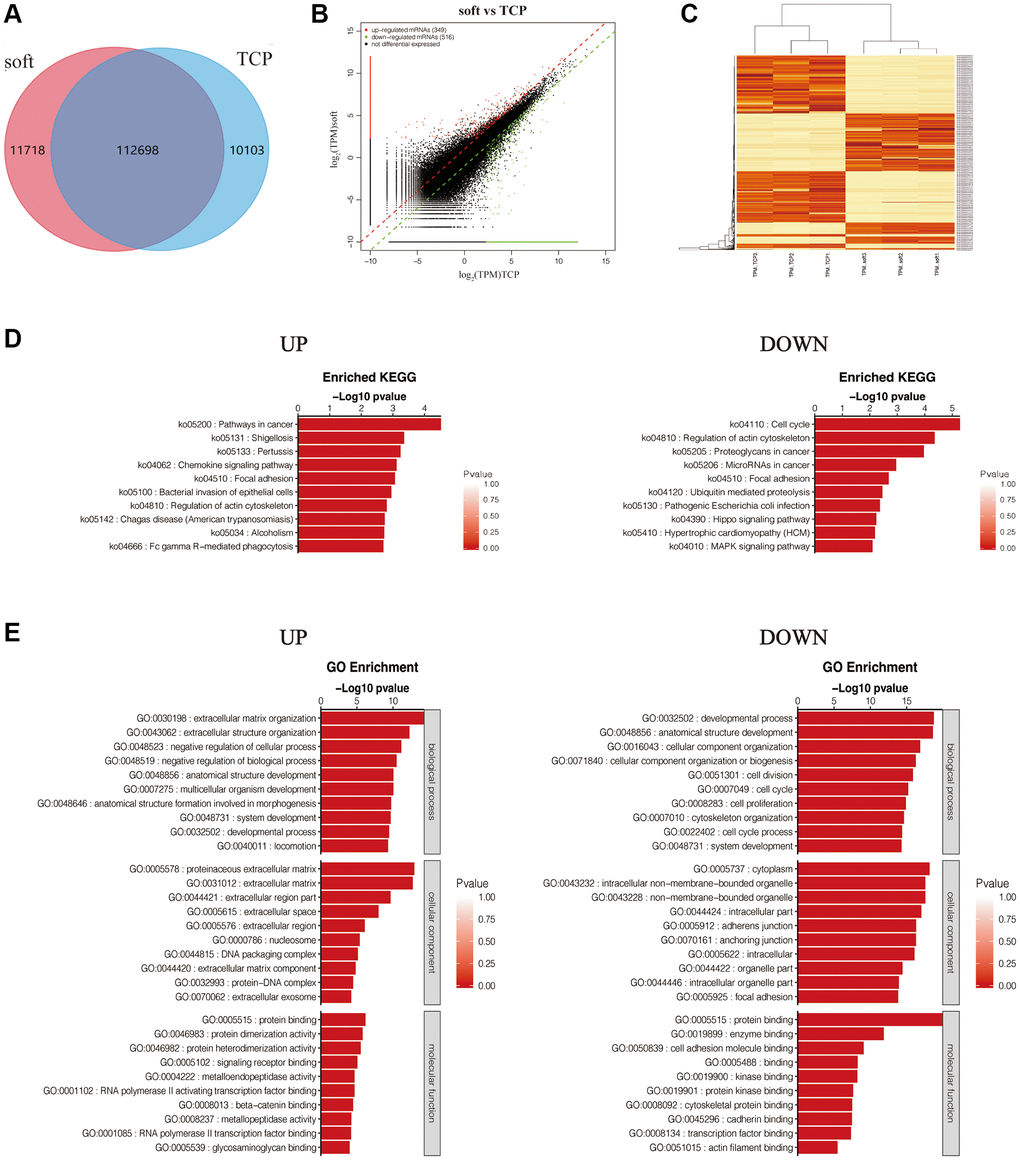
Figure 2.Differential expression analysis of soft/TCP. (A) Venn diagram of soft and TCP. (B) Scatter plot illustrated DEGs of soft/TCP. (C) Heat-map cluster analysis of DEGs. (D) KEGG pathways of up and down regulated DEGs. The color and horizontal axe were −log10 (p value) and gene number respectively. (E) GO analysis of up- and down- regulated DEGs. The GO analysis categorized mRNA into different groups: BP, CC, and MF. The color and horizontal axe were −log10 (p value) and gene number respectively.