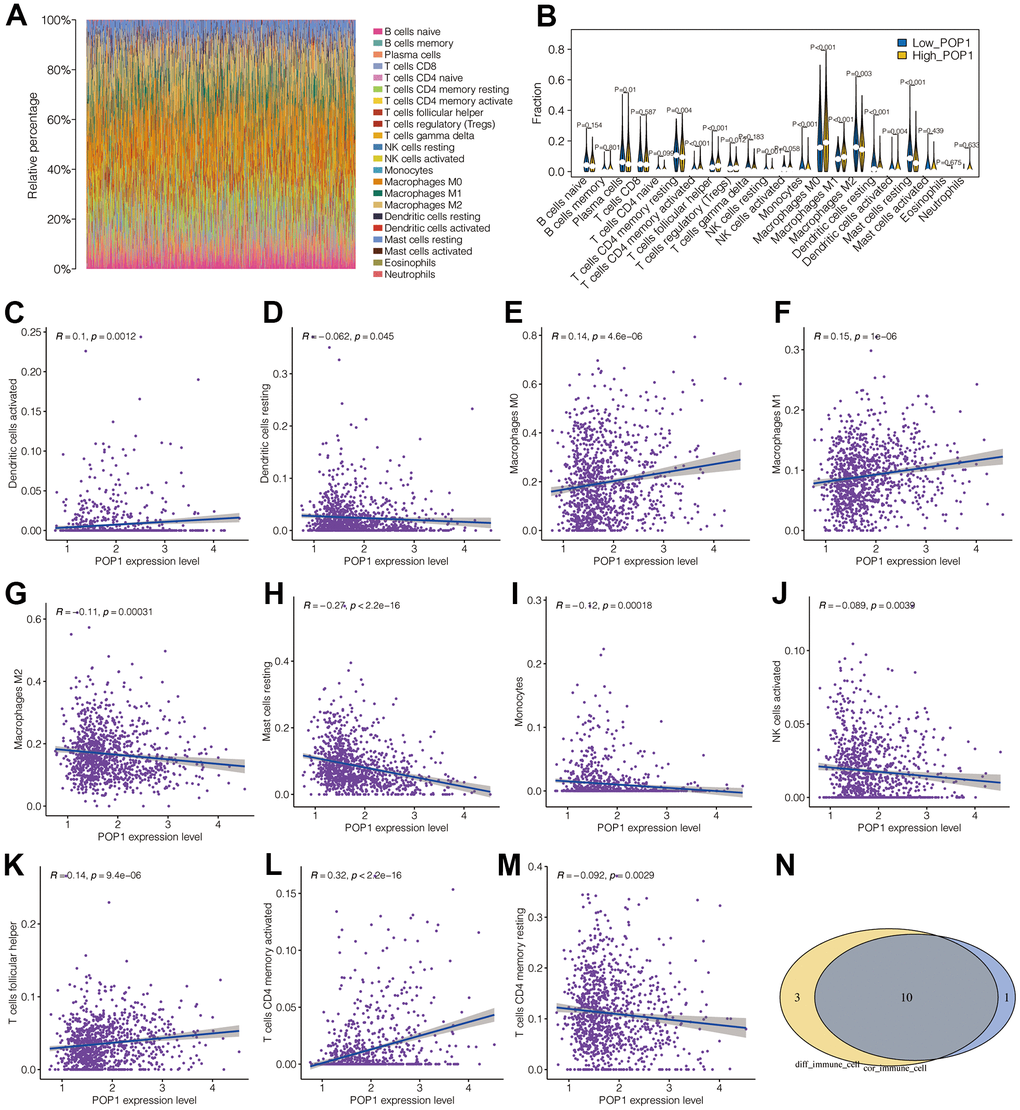
Figure 7.Correlation analysis between POP1 and immune microenvironment. (A) The landscape of immune cell infiltration in BC. (B) Difference analysis results of immune cell infiltration between the high- and low-POP1 group. (C–M) Correlation analysis showed that POP1 expression was correlated with a variety of immune cells. (N) A Venn diagram intersects the immune-cell types infiltrated differently with those associated with POP1.