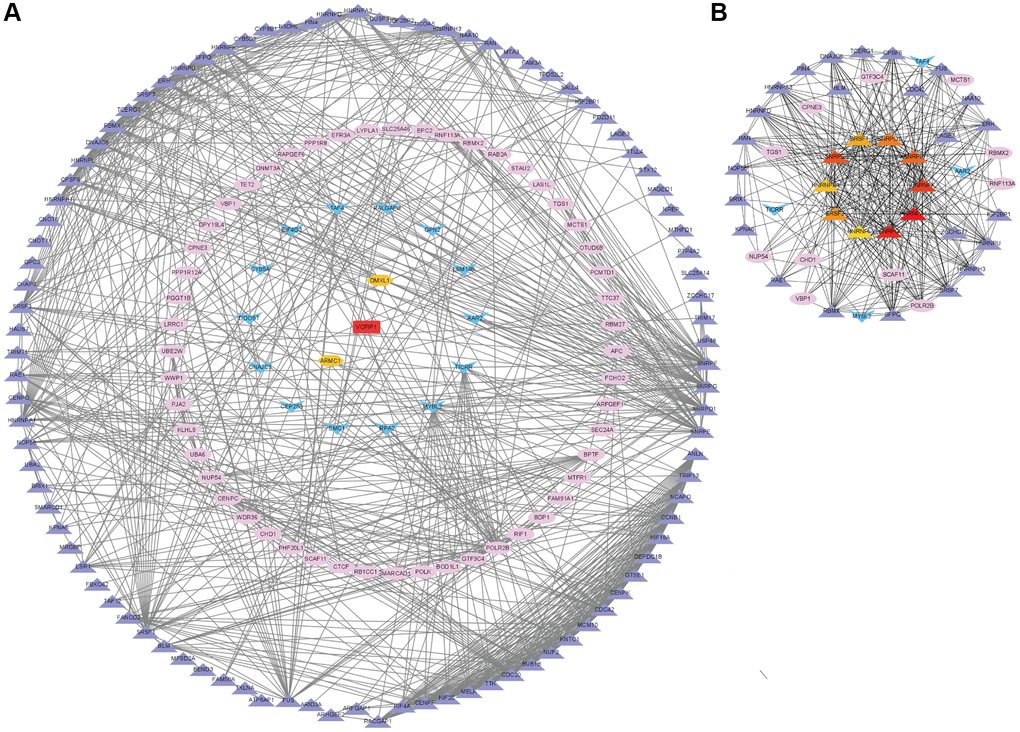
Figure 10.Co-expression network analysis of the m6A “readers” related co-expression genes in HCC. (A) The PPI network based on top 20 co-expression genes of each m6A “reader” from cBioPortal database. This network was edited by STRING database and Cytoscape software. The spearman's correlation value between m6A co-expression genes was depicted in different color (purple for more than 0.4, pink for more than 0.6, blue for more than 0.5, orange for more than 0.7 and red for more than 0.8). (B) The top 10 hub genes (little circle in the core) and their shortest paths of these co-expression genes. These data were analyzed by Cytoscape database.