Submit an Article
Navigate
Home
Editorial Board
Editorial Policies
Current Volume
Archive
Scientific Integrity
Publication Ethics Statements
Interviews with Outstanding Authors
Newsroom
Sponsored Conferences
Podcast
Contact
Special Collections
Submit an Article
Online ISSN: 1945-4589
Research Paper
|
Volume 14, Issue 15
|
pp. 6094–6110
miRNA-338-3p inhibits the migration, invasion and proliferation of human lung adenocarcinoma cells by targeting MAP3K2
Back to article
Figure 2
(2 of 10)
−
100%
+
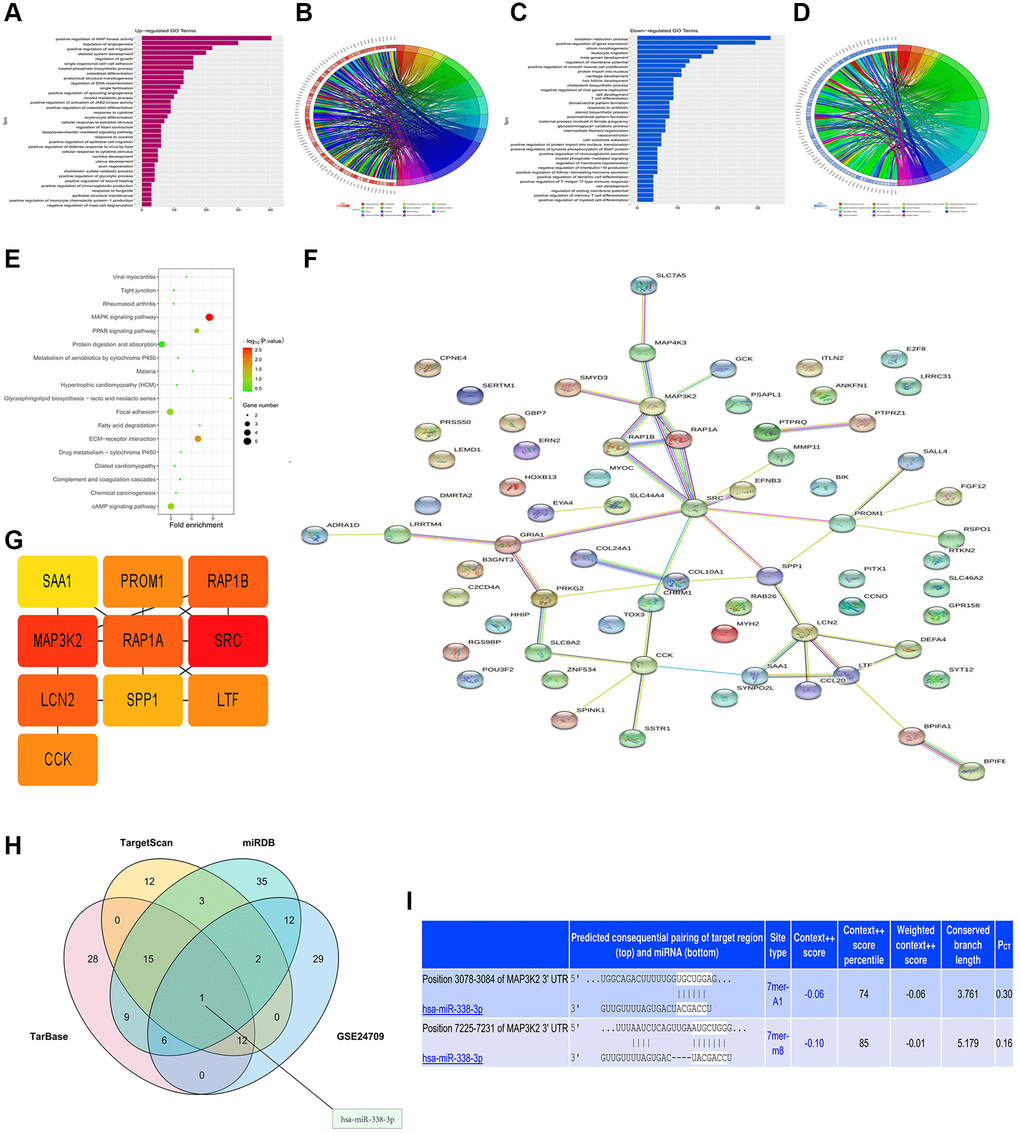
Figure 2.
Bioinformatics analysis and prediction of miRNA target genes.
(
A
,
B
) Up-regulated GO pathway of DEGs. (
C
,
D
) Down-regulated GO pathway of DEGs. (
E
) KEGG pathway chart. (
F
,
G
) Venn diagram and miRNA-mRNA binding sites (
H
,
I
).