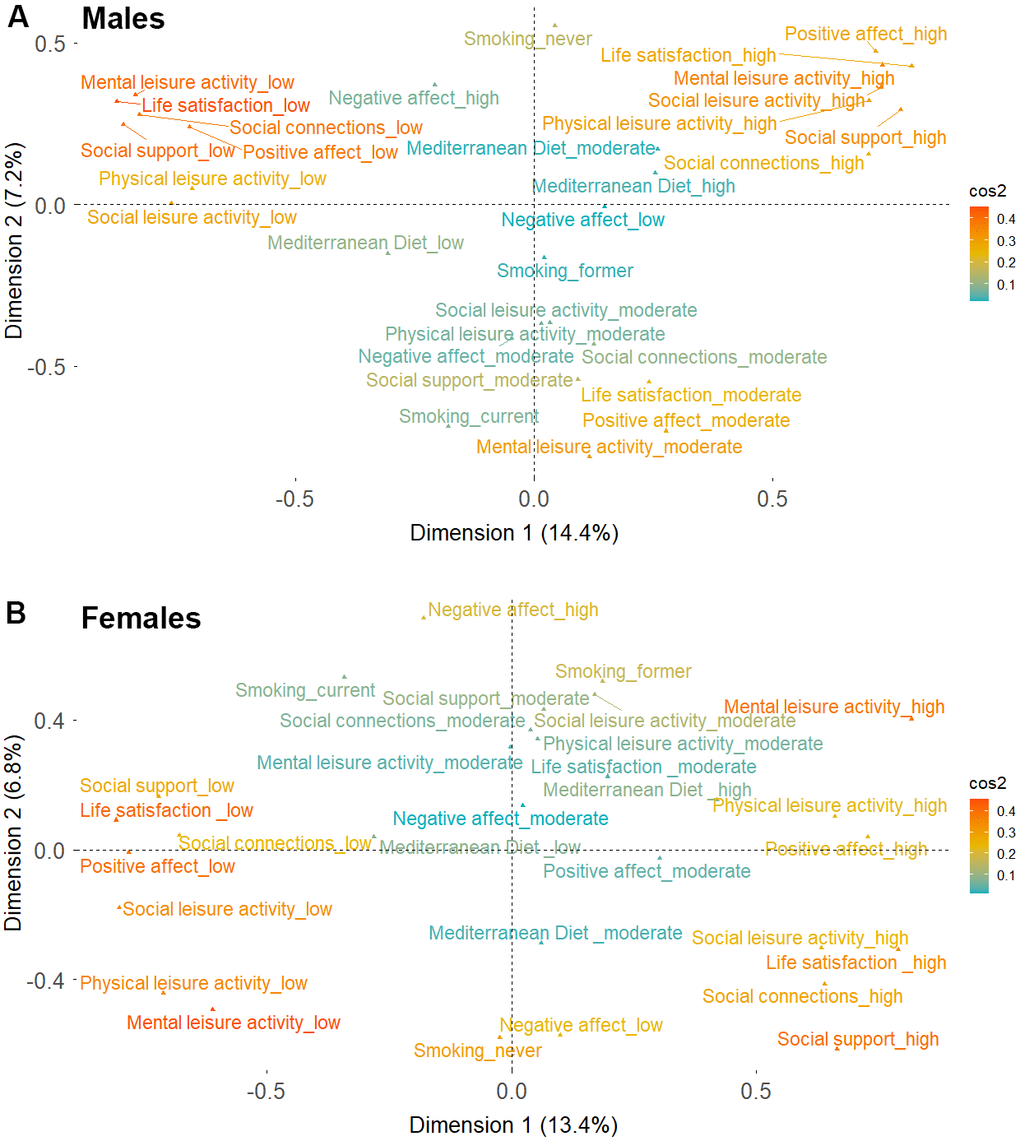
Figure 1.Two-dimensional coordinates for the different behavioral, social and psychological well-being indicators derived from multiple component analysis. (A) Males (B) Females. Cos2 color gradient represents the adequacy of the representation of the different indicators on the two-dimensional map. Cos2 values closer to one indicate a better representation of a variable’s categories over the two-dimensional map.