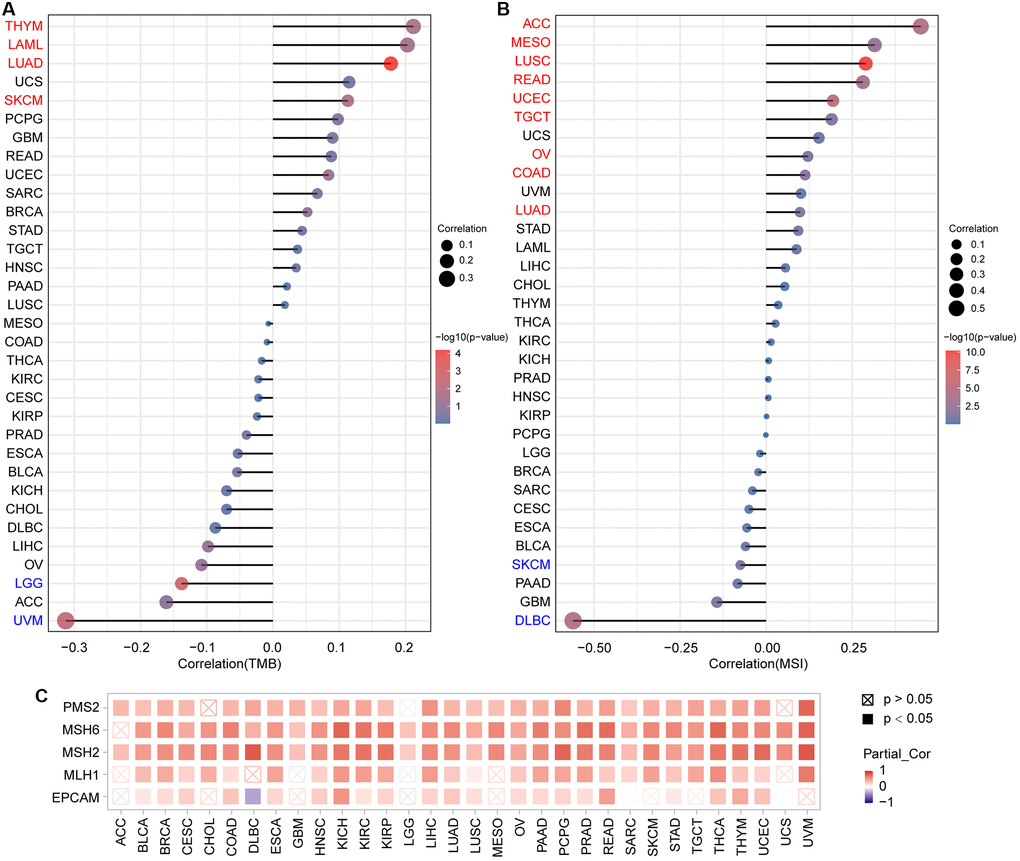
Figure 8.Analysis of the relationship between PTPN11 expression and TMB, MSI, and MMRs in human pan-cancer. (A) A stick chart depicts the association between PTPN11 expression and TMB in various malignancies. (B) A stick chart depicts the link between PTPN11 expression and MSI in various cancers. (C) Correlation between the expression of PTPN11 and MMRs.