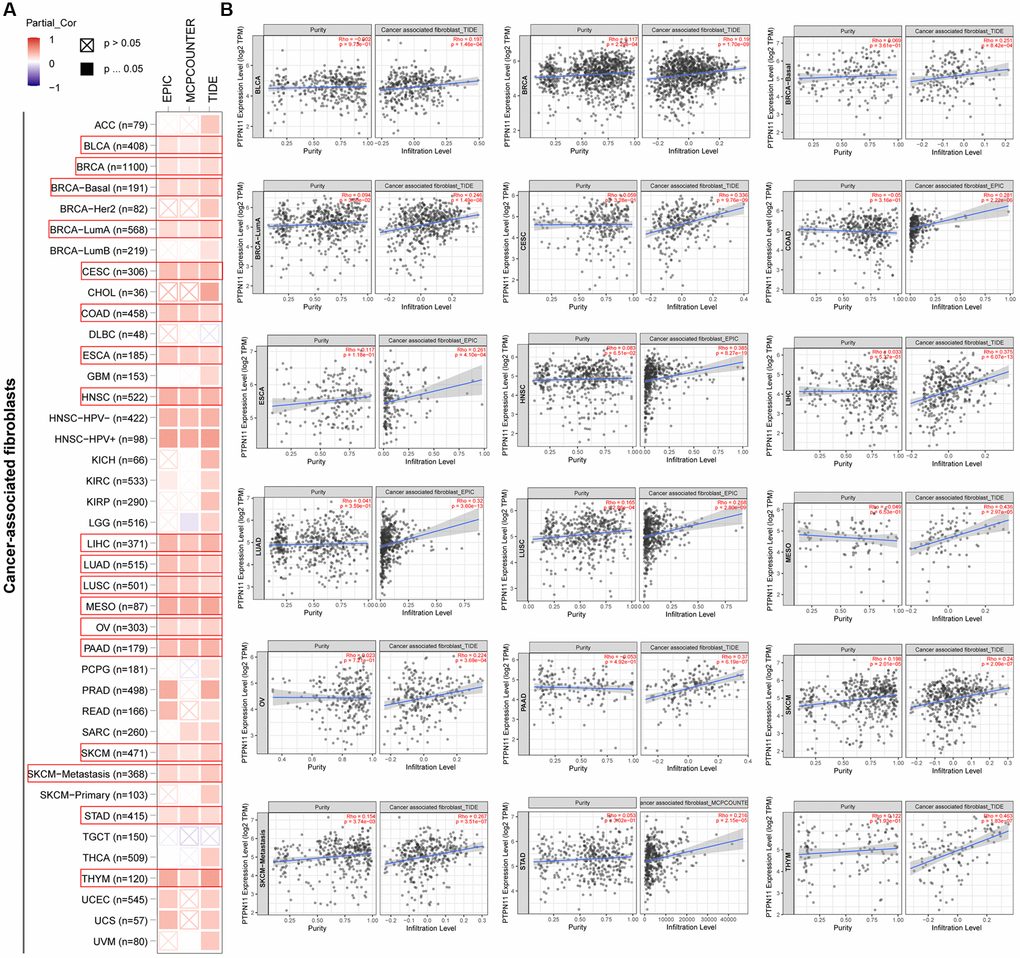
Figure 6.Analysis of the relationship between PTPN11 expression and immune infiltration of cancer-associated fibroblasts. (A) Using the EPIC, MCPCOUNTEER, and TIDE algorithms, the connection between PTPN11 expression and the amount of cancer-associated fibroblast infiltration was assessed. (B) The correlation between PTPN11 expression and cancer-associated fibroblast infiltration in BLCA, BRCA, CESC, COAD, ESCA, HNSC, LIHC, LUAD, LUSC, MESO, OV, PAAD, SKCM, STAD, and THYM.