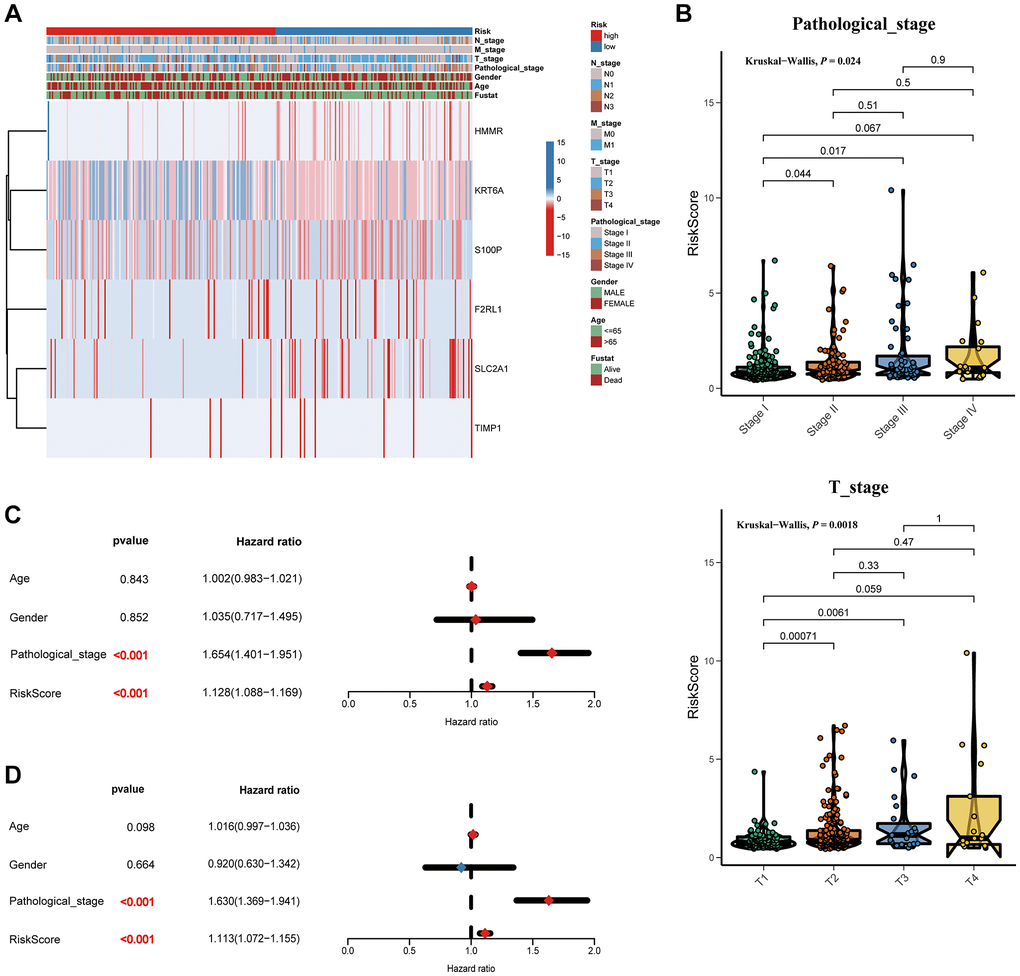
Figure 6.Correlation between the risk score and clinicopathological features. (A) Heatmap and clinicopathological features of patients classified by signature. (B) Boxplots showed the risk score with different pathological_stage and T_stage. Univariate (C) and multivariate (D) Cox regression analyses.