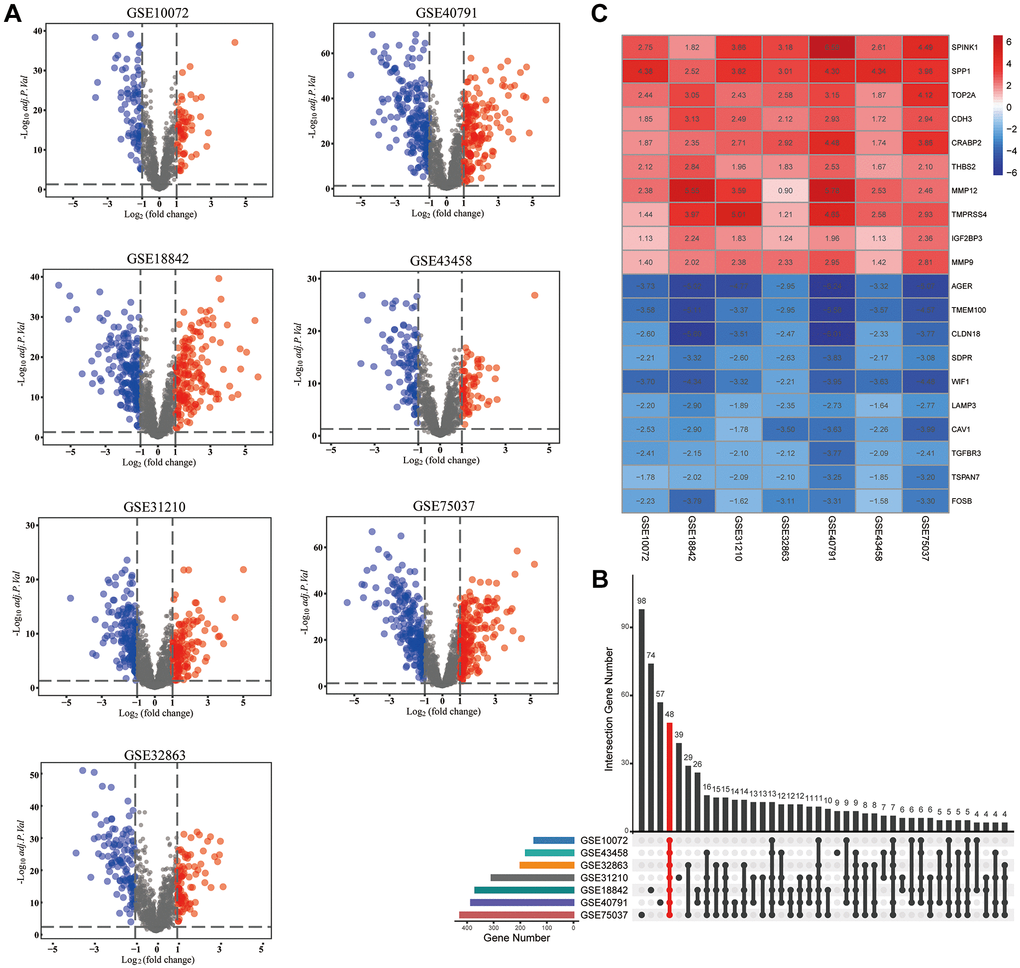
Figure 2.Identification of differentially expressed metastasis-associated genes (MAGs). (A) The volcano plots of differentially expressed MAGs in each GEO cohort, (B) Intersection plot of the MAGs in these cohorts, (C) The expression heatmap of the top 20 differentially expressed MAGs.