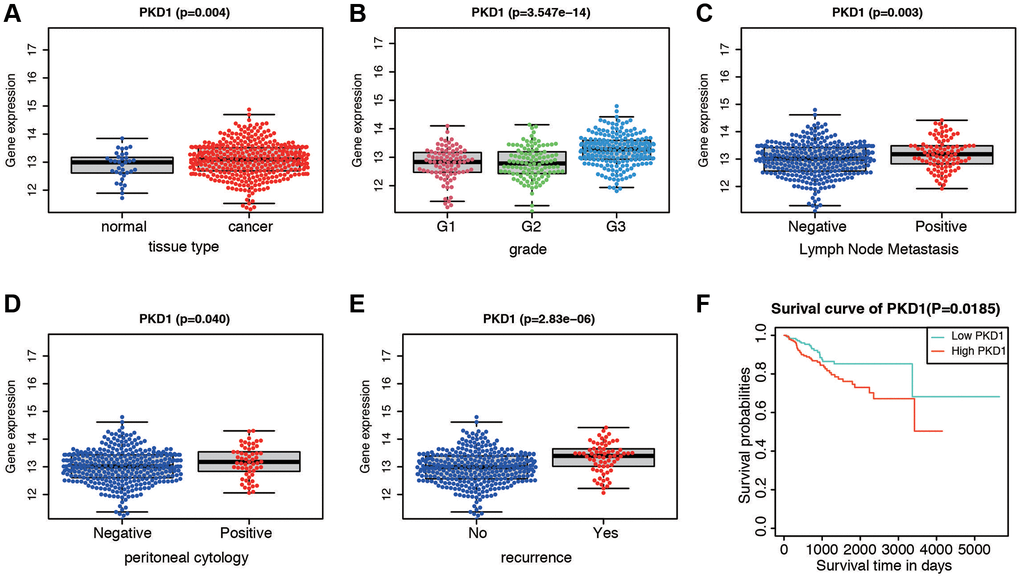
Figure 6.Expression and survival validation of PKD1 in TCGA database. Expression of PKD1 in different clinicopathological features. (A) Normal and cancer tissues. (B) Different grade. (C) Positive and negative lymph node metastasis. (D) Positive and negative peritoneal cytology. (E) Different recurrence status. (F) Kaplan-Meier survival plot of low and high expression of PKD1 according to the median value.