Submit an Article
Navigate
Home
Editorial Board
Editorial Policies
Current Volume
Archive
Scientific Integrity
Publication Ethics Statements
Interviews with Outstanding Authors
Newsroom
Sponsored Conferences
Podcast
Contact
Special Collections
Submit an Article
Online ISSN: 1945-4589
Research Paper
|
Volume 14, Issue 13
|
pp. 5417–5426
Integrated proteomics and metabolomics analysis reveals hubs protein and network alterations in myasthenia gravis
Back to article
Figure 6
(6 of 6)
−
100%
+
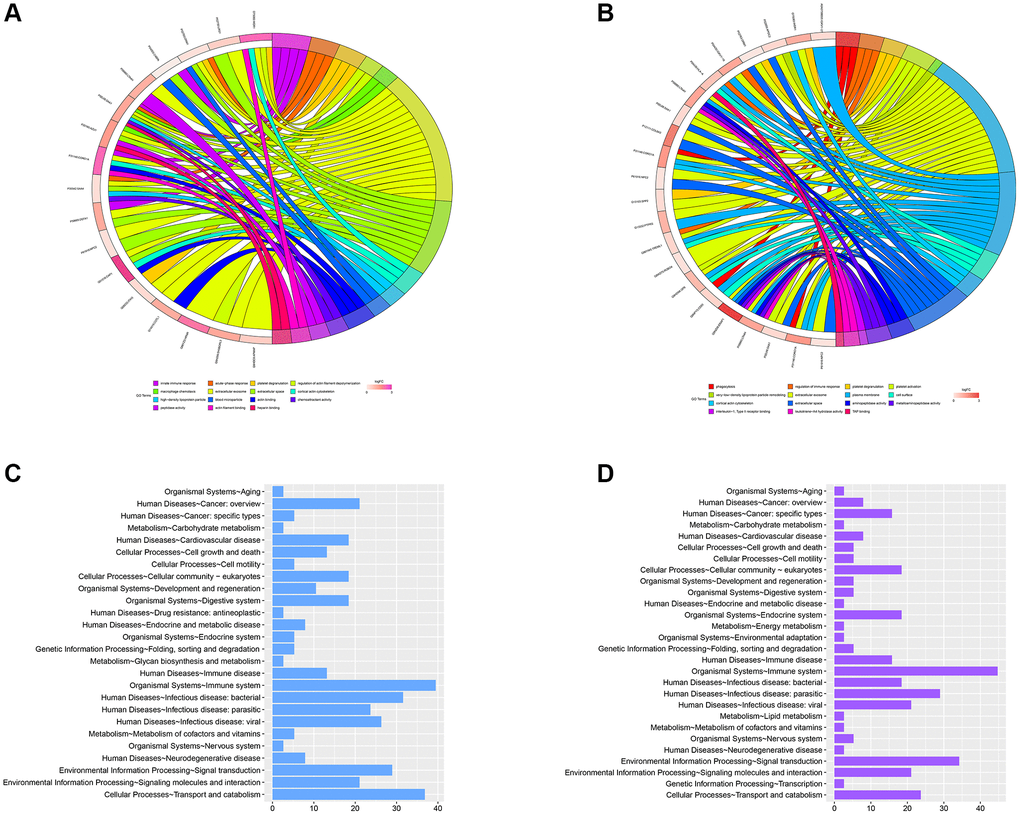
Figure 6.
GO analysis of the significant MEmagenta and MEred modules in the TAMG (+) and TAMG (−) groups.
(
A
,
B
) GO annotation for module’s DEPs. (
C
,
D
) KEGG pathway analysis of MEmagenta module.