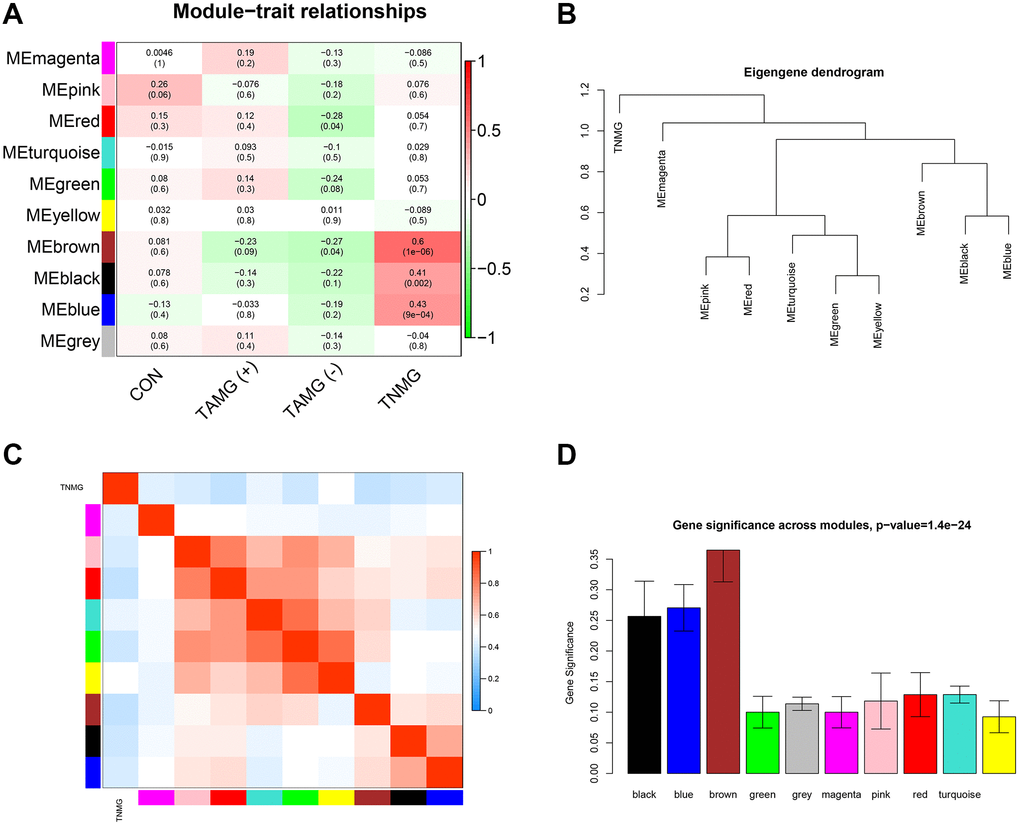
Figure 2.Modules strongly connected with TNMG, TAMG (+), and TAMG (−). (A) the module-trait correlation plot according to the clustering dendrogram of module eigengenes. (B) the module–module connection diagram. (C) analysis of the scale-free topology model. (D) protein co-expression modules with their module size.