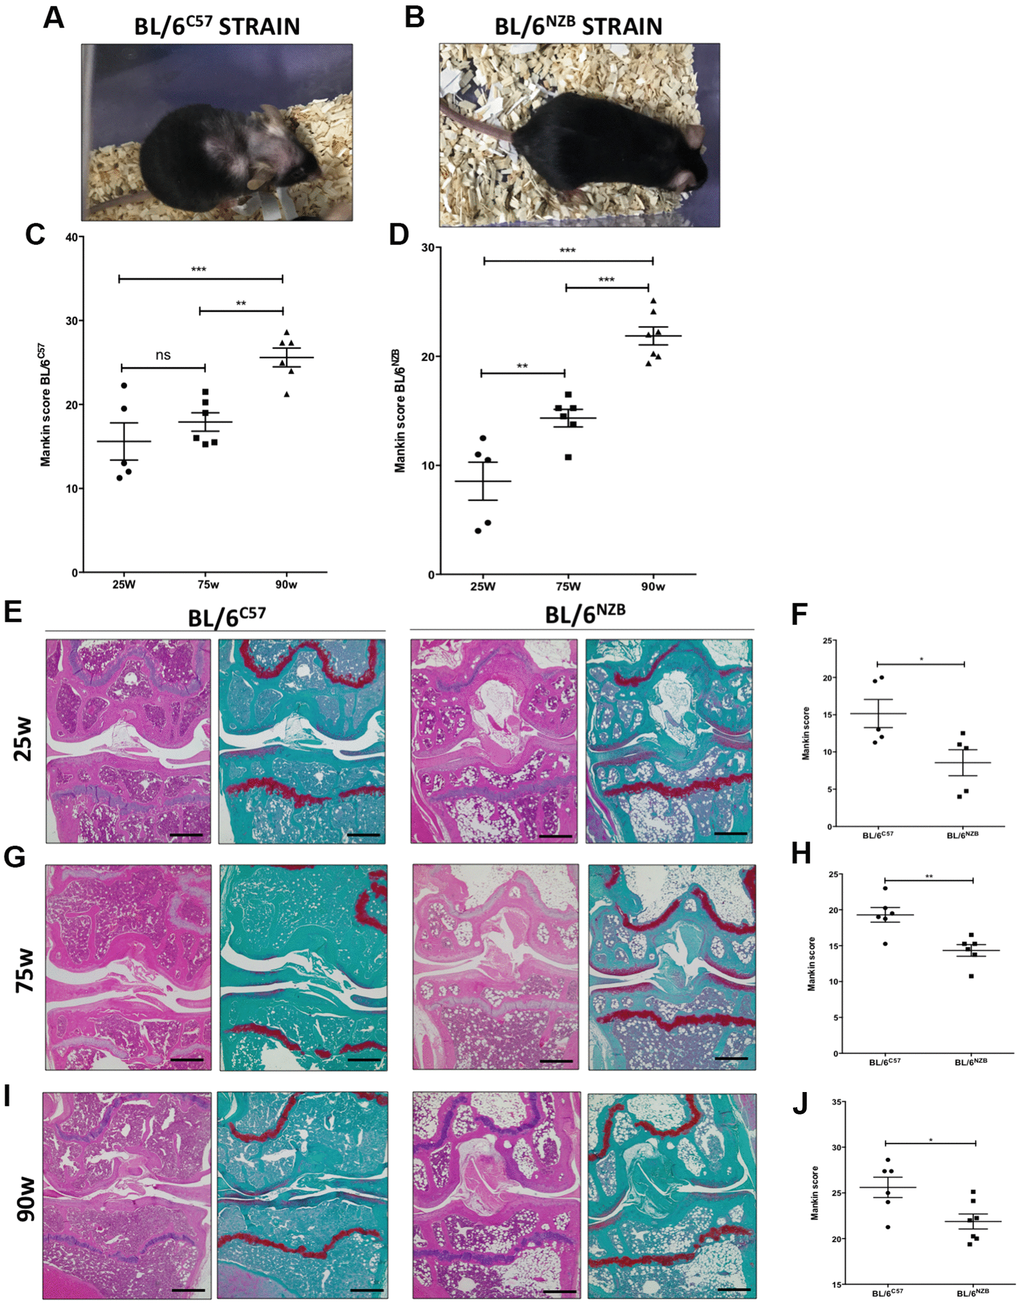
Figure 1.Analysis of Mankin scores in joints from BL/6C57 and conplastic (BL/6NZB) mice during the aging process. (A) Representative image of 90-weeks-old BL/6C57 mice. (C) Quantification of total Mankin score of the joint sections from BL/6C57 mice. (B) Representative image of 90-weeks-old conplastic (BL/6NZB) mice. (D) Quantification of total Mankin score of the joint sections from conplastic (BL/6NZB) mice. Total Mankin score was obtained from the scores of all quadrants of the joint (medial tibial plateau, medial femoral condyle, lateral tibial plateau, and lateral femoral condyle) that were scored separately and averaged. Three criteria were selected for histological assessment of each quadrant: structure, cellularity, and matrix staining. Graphs represent means ± SEM; n=5 in BL/6C57 and conplastic (BL/6NZB) mice at 25 weeks; n=6 in BL/6C57 and BL/6NZB at 75 weeks; n=6 in BL/6C57 and n=7 in BL/6NZB at 90 weeks. **p<0.01; ***p<0.001; ns=not significant by non-parametric Mann-Whitney test. (E) Representative images from joint sections of BL/6C57 and conplastic (BL/6NZB) mice at 25 weeks of age, stained with Hematoxylin-Eosin and Safranin O/Fast Green. (F) Quantification of total Mankin score of the joint sections from BL/6C57 vs. conplastic (BL/6NZB) mice at 25 weeks. (G) Representative images from joint sections of BL/6C57 and conplastic (BL/6NZB) mice at 75 weeks of age, stained with Hematoxylin-Eosin and Safranin O/Fast Green. (H) Quantification of total Mankin score of the joint sections from BL/6C57 vs. conplastic (BL/6NZB) mice at 75 weeks. (I) Representative images from joint sections of BL/6C57 and conplastic (BL/6NZB) mice at 90 weeks of age, stained with Hematoxylin-Eosin and Safranin O/Fast Green. (J) Quantification of total Mankin score of the joint sections from BL/6C57 vs. conplastic (BL/6NZB) mice at 90 weeks. Original magnification: 4×. Scale bar, 500 μm. Graphs represent means ± SEM; n=5 in BL/6C57 and conplastic (BL/6NZB) mice at 25 weeks; n=6 in BL/6C57 and conplastic (BL/6NZB) mice at 75 weeks; n=6 in BL/6C57 and n=7 in conplastic (BL/6NZB) mice at 90 weeks. *p<0.05; **p<0.01 vs. BL/6C57 by non-parametric Mann-Whitney test.