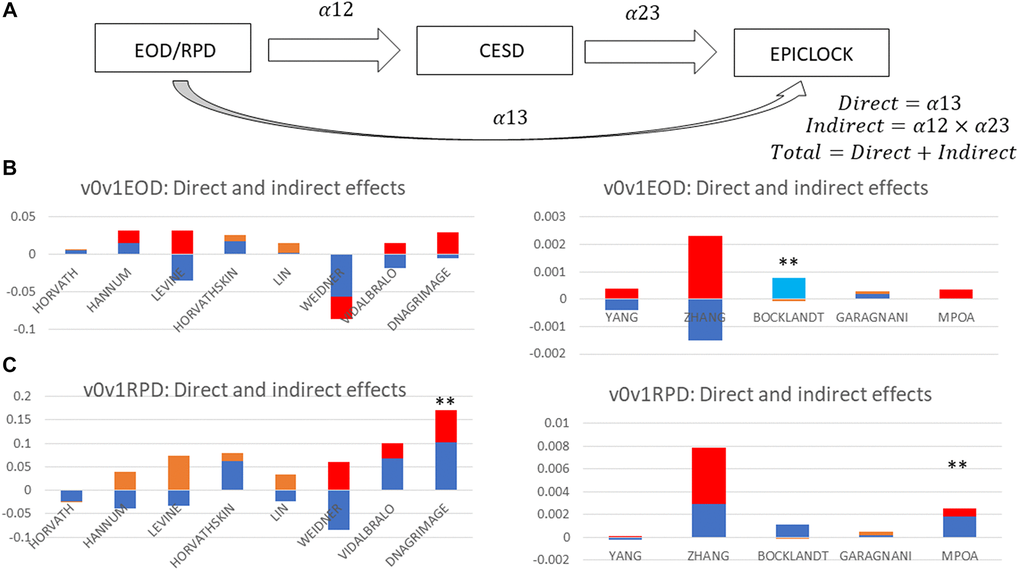
Figure 3.Total, direct and indirect effects of perceived discrimination measures on epigenetic clocks through depressive symptoms: structural equations modeling (sem); hrs 2010–2016 (n = 2,806). (A) SEM mediation model. (B) EOD as Exposure. (C) RPD as Exposure. Abbreviations: EOD: Experience of Discrimination; HRS: Health and Retirement Study; RPD: Reasons for perceived discrimination; v0: baseline visit, wave 10 (2010); v1: first follow-up visit, wave 11 (2012); v2: second follow-up visit, wave 12 (2014); v3: third follow-up visit, wave 13 (2016); v0v1: combined visits 0 and 1; v2v3: combined visits 2 and 3. See Supplementary Methods for epigenetic clock abbreviations. Note 1: SEM was conducted on epigenetic clocks as alternative outcomes, v2v3CESD total score as the mediator and EOD or RPD at v0v1 as alternative exposures. Exogenous variables are estimated age at v3, sex, and race. Figure 3 decomposes the total into direct and indirect effects of each measure of perceived discrimination. All path coefficients are shown in detail in Supplementary Table 5. Note 2: Red = Significant indirect effect at type I error of 0.05; Light blue = Significant direct effect at type I error of 0.05; Orange = Indirect effect, P > 0.05 for null hypothesis indirect effect = 0; Dark blue = Direct effect, P > 0.05 for null hypothesis direct effect = 0; **P < 0.05 for null hypothesis total effect = 0.
Figure 3 — Epigenetic clocks and their association with trajectories in perceived discrimination and depressive symptoms among US middle-aged and older adults | Aging